Here are two charts of Axis Bank — one in the 4-hour timeframe and the other in the 1-hour timeframe.
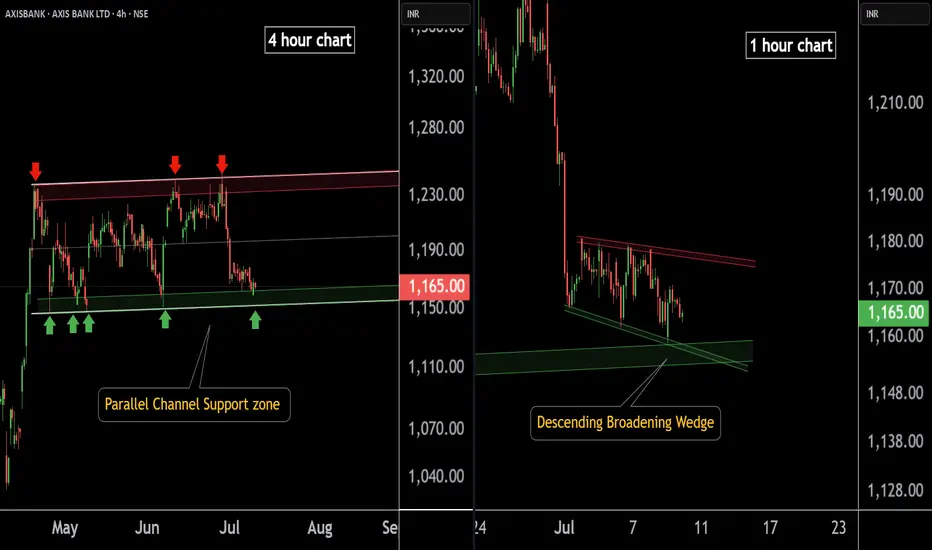
4-Hour Timeframe Chart:
In this chart, Axis Bank is moving within a parallel channel, with the support zone lying in the 1150–1160 range.
1-Hour Timeframe Chart:
Axis Bank is forming a descending broadening wedge pattern, with support near the 1150–1155 zone.
If this level is sustain ,then we may see higher prices in Axis Bank.
Thank You !!
@RahulSaraoge
Connect us at t.me/Fivecirclesofficial
Connect us at t.me/Fivecirclesofficial
Disclaimer
The information and publications are not meant to be, and do not constitute, financial, investment, trading, or other types of advice or recommendations supplied or endorsed by TradingView. Read more in the Terms of Use.