📊 AXISBANK – DAILY CHART (1D TIMEFRAME)
📅 Date: July 18, 2025
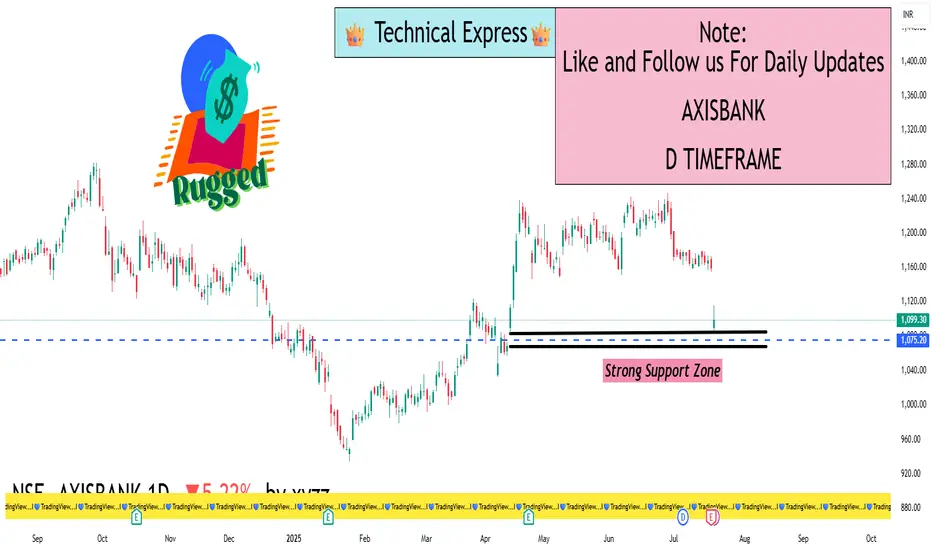
Closing Price: ₹1,099
Change: –₹60.50 (–5.2%)
Intraday Range: ₹1,074 (Low) – ₹1,159 (High)
52‑Week Range: ₹867 – ₹1,186
YTD Return: Approx. +8%
Volume: Heavier than average, indicating strong selling pressure.
⚠️ MARKET CONTEXT & TREND
Bearish Trend: Axis Bank has broken below key support zones.
Oversold RSI: While it suggests possible short-term bounce, confirmation is needed.
Strong ADX: Indicates trend strength is increasing — in this case, on the downside.
High Volume Sell-off: Indicates institutional or heavy selling pressure.
No reversal indicators yet – MACD is still negative and falling.
🔍 SUMMARY VIEW
Trend: Strongly Bearish
Momentum: Weak, heavily oversold
Volatility: High
Reversal Signs: Not yet confirmed
Short-Term Outlook: Bearish to sideway unless price reclaims ₹1,120–1,150 zone
🔮 WHAT TO WATCH NEXT
Reversal Confirmation: Look for RSI climbing back above 30 and MACD crossover.
Volume Drop on Red Days: If selling volume dries up, it may signal weakening bears.
Breakout above ₹1,150: Could confirm fresh buying and trend reversal.
Further Drop Below ₹1,070: Could lead to panic selling and deeper correction
📅 Date: July 18, 2025
Closing Price: ₹1,099
Change: –₹60.50 (–5.2%)
Intraday Range: ₹1,074 (Low) – ₹1,159 (High)
52‑Week Range: ₹867 – ₹1,186
YTD Return: Approx. +8%
Volume: Heavier than average, indicating strong selling pressure.
⚠️ MARKET CONTEXT & TREND
Bearish Trend: Axis Bank has broken below key support zones.
Oversold RSI: While it suggests possible short-term bounce, confirmation is needed.
Strong ADX: Indicates trend strength is increasing — in this case, on the downside.
High Volume Sell-off: Indicates institutional or heavy selling pressure.
No reversal indicators yet – MACD is still negative and falling.
🔍 SUMMARY VIEW
Trend: Strongly Bearish
Momentum: Weak, heavily oversold
Volatility: High
Reversal Signs: Not yet confirmed
Short-Term Outlook: Bearish to sideway unless price reclaims ₹1,120–1,150 zone
🔮 WHAT TO WATCH NEXT
Reversal Confirmation: Look for RSI climbing back above 30 and MACD crossover.
Volume Drop on Red Days: If selling volume dries up, it may signal weakening bears.
Breakout above ₹1,150: Could confirm fresh buying and trend reversal.
Further Drop Below ₹1,070: Could lead to panic selling and deeper correction
Hello Guys ..
WhatsApp link- wa.link/d997q0
Email - techncialexpress@gmail.com ...
Script Coder/Trader//Investor from India. Drop a comment or DM if you have any questions! Let’s grow together!
WhatsApp link- wa.link/d997q0
Email - techncialexpress@gmail.com ...
Script Coder/Trader//Investor from India. Drop a comment or DM if you have any questions! Let’s grow together!
Related publications
Disclaimer
The information and publications are not meant to be, and do not constitute, financial, investment, trading, or other types of advice or recommendations supplied or endorsed by TradingView. Read more in the Terms of Use.