AXON: Navigating Support After Short-Term Trend Reversal
Overall Trend and Channels:
The stock has been in a clear uptrend since late February/early March, characterized by higher highs and higher lows.
Two ascending channels are identified:
Identified Support Levels:
Historical Volatility and Support Tests (Lower Blue Ellipses):
In summary, the chart indicates that AXON has recently broken down from its immediate short-term uptrend. Technical analysts would now be observing whether the price finds support at the 700-715 zone, which is reinforced by the broader trend channel. Further downside could test the 650 area (potentially triggered by earnings), with the 575-level serving as a critical, long-term historical support floor.
Disclaimer:
The information provided in this chart is for educational and informational purposes only and should not be considered as investment advice. Trading and investing involve substantial risk and are not suitable for every investor. You should carefully consider your financial situation and consult with a financial advisor before making any investment decisions. The creator of this chart does not guarantee any specific outcome or profit and is not responsible for any losses incurred as a result of using this information. Past performance is not indicative of future results. Use this information at your own risk. This chart has been created for my own improvement in Trading and Investment Analysis. Please do your own analysis before any investments.
Overall Trend and Channels:
The stock has been in a clear uptrend since late February/early March, characterized by higher highs and higher lows.
Two ascending channels are identified:
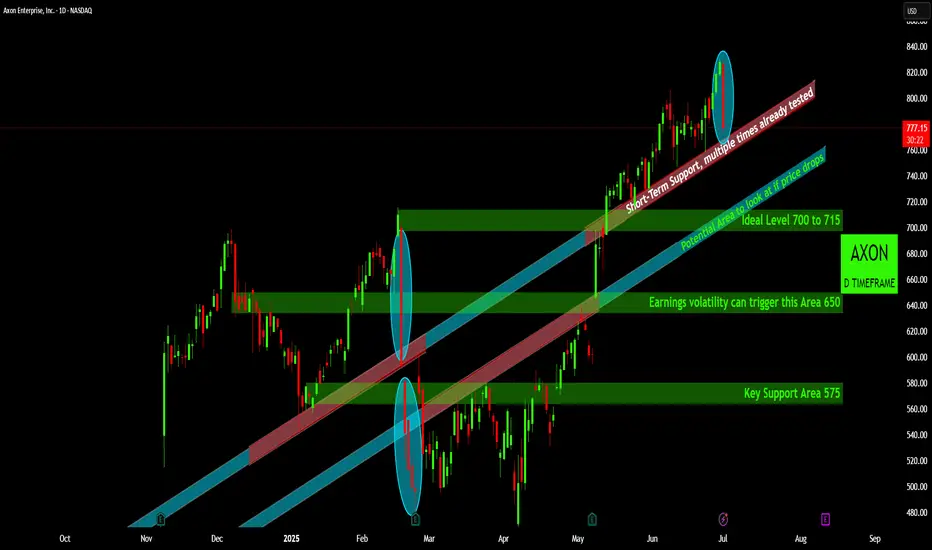
- A red diagonal band labeled "Short-Term Support, multiple times already tested" represents a steeper, more immediate trendline that the price has followed closely.
- A blue diagonal channel appears to define a broader, less aggressive uptrend, encompassing the price action over a longer period.
Recent Price Action and Breakdown: - The most recent price action, highlighted by the upper blue ellipse, shows a significant red candlestick indicating a strong down move. This candlestick has clearly broken below the "Short-Term Support" (red diagonal band).
- This breakdown suggests a loss of immediate bullish momentum and a potential shift into a corrective or consolidation phase after an extended rally. The current price of 777.05 is now below this previously established dynamic support.
Identified Support Levels:
- Potential Area 700 to 715 (Green Horizontal Box): This zone is marked as the "Potential Area to look at if price drops" and "Ideal Level." It represents the next significant horizontal support level that the price could test if the current decline continues. This area also appears to align with the lower boundary of the broader blue ascending channel, providing confluence and strengthening its significance as potential support.
- Earnings Volatility Area 650 (Green Horizontal Box): This level is identified as a potential support that "Earnings volatility can trigger." This suggests it's a known historical support that might be tested under conditions of significant selling pressure, such as a negative reaction to earnings reports.
- Key Support Area 575 (Green Horizontal Box): This is the lowest and appears to be the strongest support level highlighted on the chart, labeled as "Key Support Area." This typically implies a major historical turning point or a strong accumulation zone where buyers have previously stepped in forcefully.
Historical Volatility and Support Tests (Lower Blue Ellipses):
- The middle blue ellipse around late February highlights a prior instance where the price experienced a sharp decline, breaking through an earlier support level (likely the upper boundary of the blue channel that turned into resistance after breaking above it later on) before finding temporary support.
- The bottom blue ellipse in early March highlights a substantial plunge in price that tested and found strong support at the "Key Support Area 575," followed by a significant bounce. This confirms the historical importance and strength of the 575 level.
In summary, the chart indicates that AXON has recently broken down from its immediate short-term uptrend. Technical analysts would now be observing whether the price finds support at the 700-715 zone, which is reinforced by the broader trend channel. Further downside could test the 650 area (potentially triggered by earnings), with the 575-level serving as a critical, long-term historical support floor.
Disclaimer:
The information provided in this chart is for educational and informational purposes only and should not be considered as investment advice. Trading and investing involve substantial risk and are not suitable for every investor. You should carefully consider your financial situation and consult with a financial advisor before making any investment decisions. The creator of this chart does not guarantee any specific outcome or profit and is not responsible for any losses incurred as a result of using this information. Past performance is not indicative of future results. Use this information at your own risk. This chart has been created for my own improvement in Trading and Investment Analysis. Please do your own analysis before any investments.
Disclaimer
The information and publications are not meant to be, and do not constitute, financial, investment, trading, or other types of advice or recommendations supplied or endorsed by TradingView. Read more in the Terms of Use.
Disclaimer
The information and publications are not meant to be, and do not constitute, financial, investment, trading, or other types of advice or recommendations supplied or endorsed by TradingView. Read more in the Terms of Use.