Hello traders .
Did you remember my last idea about the AXS ? in that idea I was talked a big move for the AXS , am I still think that the AXS is about to do something explosive or not ?
If you want to read my last idea , you can find it in the related ideas down below this idea 👇
1_pattern :

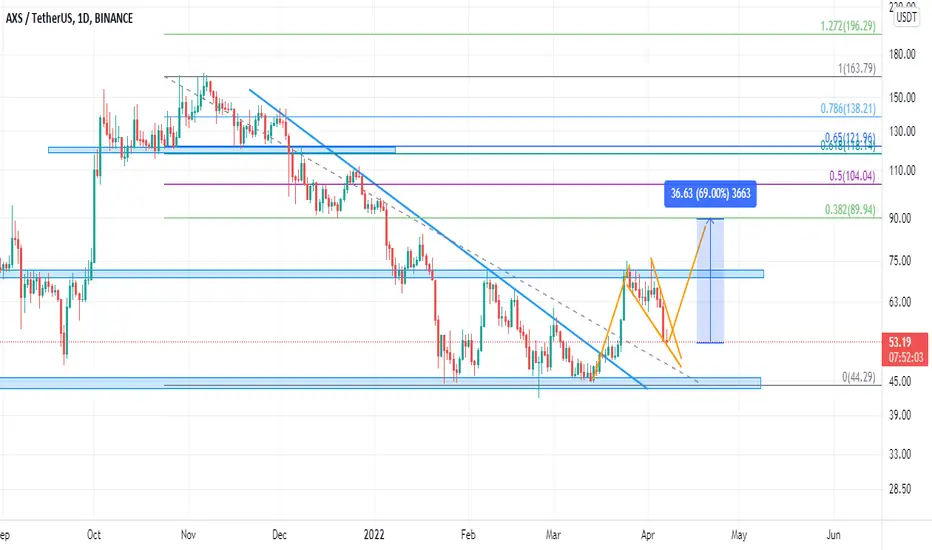
In the chart above you can see that the price after testing the daily resistance structure started to retracement and currently price is in the falling wedge pattern which is a bullish pattern and when you see this pattern in a bullish trend you like what we have in the above picture you could call that as a flag pattern .
2_EMA Ribbon :

you can see that after price break above the the EMA Ribbon , it started to flipping bullish but after price hitting the the daily resistance , price started to retracement and break below the EMA Ribbon again , but still there is chance to goes above the EMA Ribbon again because the overall trend is still bullish in the daily time frame and AXS price didn't create a lower low .
3_TSI & RSI :

In the RSI we had a bearish divergence in the smaller time frame which is also obvious in the daily chart and this was a sign for the short term trend reversal , so by knowing that , you could take some profit from your long position or maybe open a short position after getting the confirmation of that .
In the TSI you can see that the it started to flip bearish but it still above the zero line so I personally don't consider it as a bearish sign .
4_ price target :

If price decided to break above the falling wedge or in the other word , flag pattern , the technical target of it , is near to the 0.382 Fibonacci level .
This is not a Financial advice and always trade based on your trading strategy ; have nice day my dear friends .
Did you remember my last idea about the AXS ? in that idea I was talked a big move for the AXS , am I still think that the AXS is about to do something explosive or not ?
If you want to read my last idea , you can find it in the related ideas down below this idea 👇
1_pattern :
In the chart above you can see that the price after testing the daily resistance structure started to retracement and currently price is in the falling wedge pattern which is a bullish pattern and when you see this pattern in a bullish trend you like what we have in the above picture you could call that as a flag pattern .
2_EMA Ribbon :
you can see that after price break above the the EMA Ribbon , it started to flipping bullish but after price hitting the the daily resistance , price started to retracement and break below the EMA Ribbon again , but still there is chance to goes above the EMA Ribbon again because the overall trend is still bullish in the daily time frame and AXS price didn't create a lower low .
3_TSI & RSI :
In the RSI we had a bearish divergence in the smaller time frame which is also obvious in the daily chart and this was a sign for the short term trend reversal , so by knowing that , you could take some profit from your long position or maybe open a short position after getting the confirmation of that .
In the TSI you can see that the it started to flip bearish but it still above the zero line so I personally don't consider it as a bearish sign .
4_ price target :
If price decided to break above the falling wedge or in the other word , flag pattern , the technical target of it , is near to the 0.382 Fibonacci level .
This is not a Financial advice and always trade based on your trading strategy ; have nice day my dear friends .
_____________________________________
🐺 Discipline is rarely enjoyable ,
But almost always profitable 🐺
TElEGRAM CHANNEL : t.me/KIU_COIN
_____________________________________
🐺 Discipline is rarely enjoyable ,
But almost always profitable 🐺
TElEGRAM CHANNEL : t.me/KIU_COIN
_____________________________________
Related publications
Disclaimer
The information and publications are not meant to be, and do not constitute, financial, investment, trading, or other types of advice or recommendations supplied or endorsed by TradingView. Read more in the Terms of Use.
_____________________________________
🐺 Discipline is rarely enjoyable ,
But almost always profitable 🐺
TElEGRAM CHANNEL : t.me/KIU_COIN
_____________________________________
🐺 Discipline is rarely enjoyable ,
But almost always profitable 🐺
TElEGRAM CHANNEL : t.me/KIU_COIN
_____________________________________
Related publications
Disclaimer
The information and publications are not meant to be, and do not constitute, financial, investment, trading, or other types of advice or recommendations supplied or endorsed by TradingView. Read more in the Terms of Use.