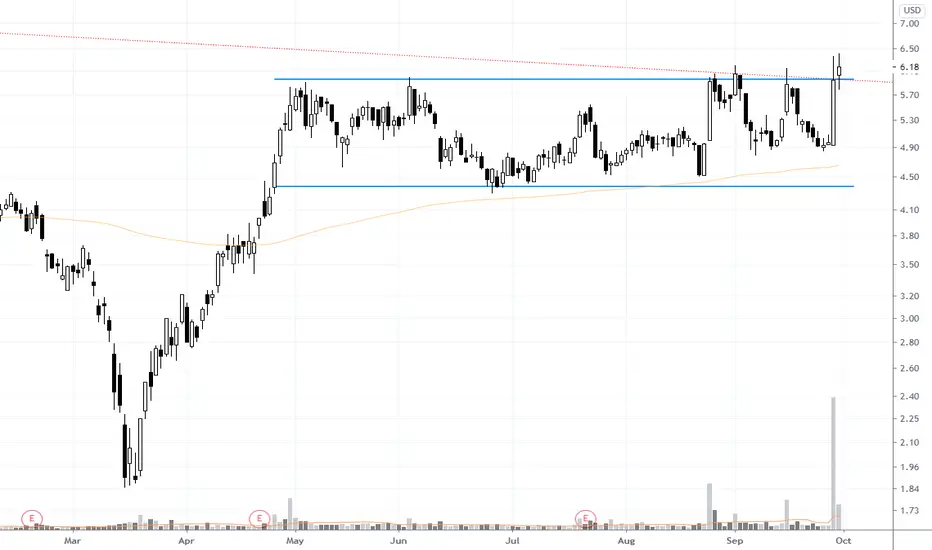
1) Massive volume yesterday and heavy volume so far today
2) day not over yet but probably closes above 5 month rectangle resistance (blue line on chart)
3) Also breaking above weekly down trend line (red line on chart)
4) $6 price level tested 6 times
looks like a good long trade setting up. A bit volatile stock with wide moves. Size your shares appropriately.
✔ Momentum & Breakout Trader Since 2006 | Influenced by Mark Minervini VCP Trading Style & William O'Neil CANSLIM 📈
✔ Follow me on Twitter @taplot - twitter.com/TaPlot
✔ YouTube channel youtube.com/@taplot
✔ Follow me on Twitter @taplot - twitter.com/TaPlot
✔ YouTube channel youtube.com/@taplot
Disclaimer
The information and publications are not meant to be, and do not constitute, financial, investment, trading, or other types of advice or recommendations supplied or endorsed by TradingView. Read more in the Terms of Use.