*investment opportunity*
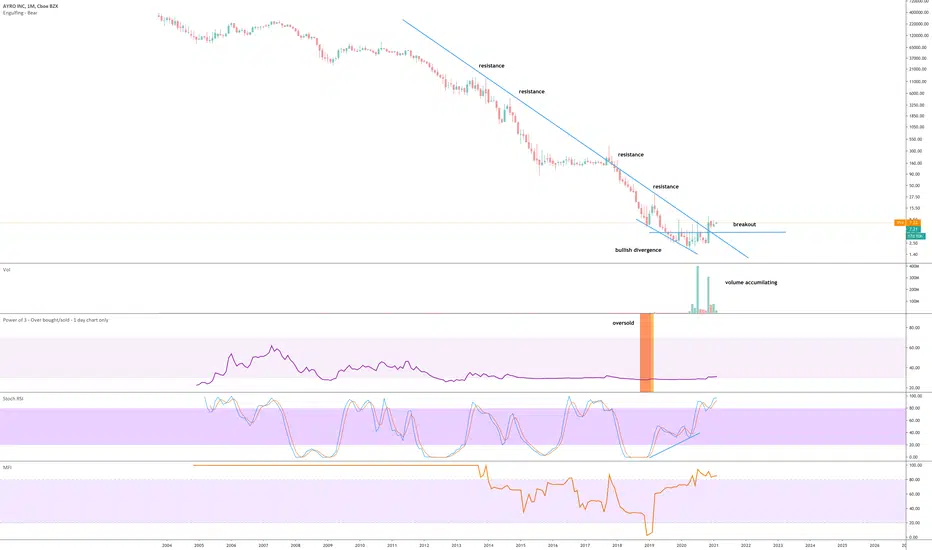
On the above monthly chart 7 years of price action resistance comes to an end following an oversold condition (orange column) with price action breakout. There now exists a number of reasons to be bullish on AYRO, they include:
1) Regular bullish divergence. Price action made lower lows as the oscillators made higher highs - very bullish.
2) Together with point (1) volume is accumulating. Someone knows something I don’t!
3) On the 6-month chart (below) there is a large ‘morning star’ candle with bullish engulfing candle confirmation. Very bullish on this scale making a trend reversal highly probable.
4) Lastly on the weekly chart (below) we have the 21-week (yellow) moving average crossing up the 50-week (Green) moving average. Been over 14 years since that happened.
Institutions such Blackrock, amongst others, make up for 3% of the shareholders of this stock.
A buy from $4.25 is excellent.
Weekly chart:

6-month chart:

On the above monthly chart 7 years of price action resistance comes to an end following an oversold condition (orange column) with price action breakout. There now exists a number of reasons to be bullish on AYRO, they include:
1) Regular bullish divergence. Price action made lower lows as the oscillators made higher highs - very bullish.
2) Together with point (1) volume is accumulating. Someone knows something I don’t!
3) On the 6-month chart (below) there is a large ‘morning star’ candle with bullish engulfing candle confirmation. Very bullish on this scale making a trend reversal highly probable.
4) Lastly on the weekly chart (below) we have the 21-week (yellow) moving average crossing up the 50-week (Green) moving average. Been over 14 years since that happened.
Institutions such Blackrock, amongst others, make up for 3% of the shareholders of this stock.
A buy from $4.25 is excellent.
Weekly chart:
6-month chart:
Trade active
50% in 24 hours ?!Trade active
Good long entry point as price action lands on the golden ratio.Trade active
RSI returns to strong support (purple circles) on the 10-day chart - look left.Trade active
On the 2-week chart a dragonfly DOJI candle prints as stochastic RSI crosses up 20 (purple circle)Note
Just had an alarm go off on this one to inform me the downtrend in price action resistance is now broken. That's a positive.BTC
bc1q2eckdzh0q8vsd7swcc8et6ze7s99khhxyl7zwy
Weblink: patreon.com/withoutworries
Allow 3-6 months on ideas. Not investment advice. DYOR
bc1q2eckdzh0q8vsd7swcc8et6ze7s99khhxyl7zwy
Weblink: patreon.com/withoutworries
Allow 3-6 months on ideas. Not investment advice. DYOR
Disclaimer
The information and publications are not meant to be, and do not constitute, financial, investment, trading, or other types of advice or recommendations supplied or endorsed by TradingView. Read more in the Terms of Use.
BTC
bc1q2eckdzh0q8vsd7swcc8et6ze7s99khhxyl7zwy
Weblink: patreon.com/withoutworries
Allow 3-6 months on ideas. Not investment advice. DYOR
bc1q2eckdzh0q8vsd7swcc8et6ze7s99khhxyl7zwy
Weblink: patreon.com/withoutworries
Allow 3-6 months on ideas. Not investment advice. DYOR
Disclaimer
The information and publications are not meant to be, and do not constitute, financial, investment, trading, or other types of advice or recommendations supplied or endorsed by TradingView. Read more in the Terms of Use.