Monthly chart 3 black crows candlestick = Bearish
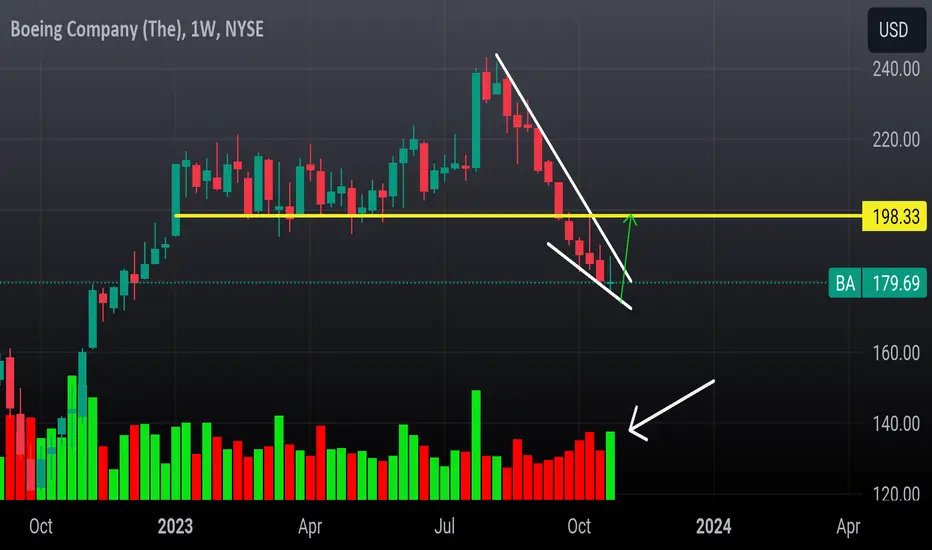
Weekly chart
Gravestone doji Reversal candle with strong volume. = Bullish.
Daily chart falling wedge pattern that would take us back to 198-200..
I seriously doubt we break over 200 because of the price action and weekly 200sma.
Weekly chart
Gravestone doji Reversal candle with strong volume. = Bullish.
Daily chart falling wedge pattern that would take us back to 198-200..
I seriously doubt we break over 200 because of the price action and weekly 200sma.
Note
Qqq tagged resistance too..Price can chop up at resistance a few days before curling over.
Monthly pattern is still 3 black crows which means by Mid November we should be headed for a lower low on the monthly
Note
Distribution or supply area up hereDisclaimer
The information and publications are not meant to be, and do not constitute, financial, investment, trading, or other types of advice or recommendations supplied or endorsed by TradingView. Read more in the Terms of Use.
Disclaimer
The information and publications are not meant to be, and do not constitute, financial, investment, trading, or other types of advice or recommendations supplied or endorsed by TradingView. Read more in the Terms of Use.