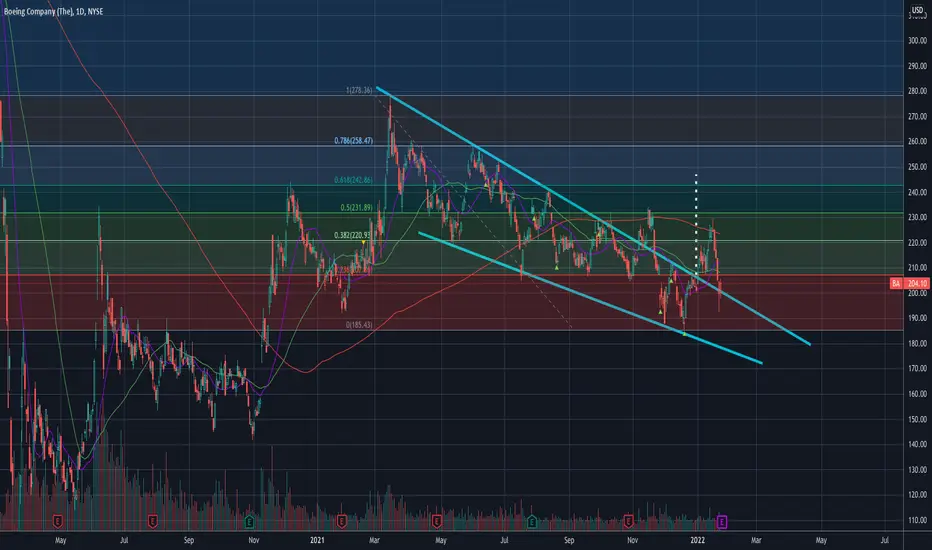
In my previous chart, I mentioned that BA could play out double bottom and it did.
Since then, BA has pulled back and now retesting the descending wedge. Will it bounce from here, or will it break down like it did before?
It seems $230 area has been painfully stubborn area.
If it bounce from here and break above $210, there is a chance that it can see $230 again. If by some miracle, it breaks through $230, we can expect $245 area.
On the other hand, if it breaks down from here, it can revisit $185 area.
It's all depends on whether we stay above $199 or breaks below it.
Bullish target 1 - $230
Bullish target 2 - $245
Bearish target - $185
Earning on 01/26 (tmr) will determine if we see $230 or $185. We won't have to wait long.
———————————————————
How to read my charts?
- Matching color trend lines shows the pattern. Sometimes a chart can have multiple patterns. Each pattern will have matching color trend lines.
- The yellow horizontal lines shows support and resistance areas.
- Fib lines also shows support and resistance areas.
- The dotted white lines shows price projection for breakout or breakdown target.
Disclaimer: Do your own DD. Not an investment advice.
I am not a licensed professional. None of the posts that I published are investment advice. Do your own research.
Disclaimer
The information and publications are not meant to be, and do not constitute, financial, investment, trading, or other types of advice or recommendations supplied or endorsed by TradingView. Read more in the Terms of Use.