Adventure Idea: The Return of Boeing  BA
BA
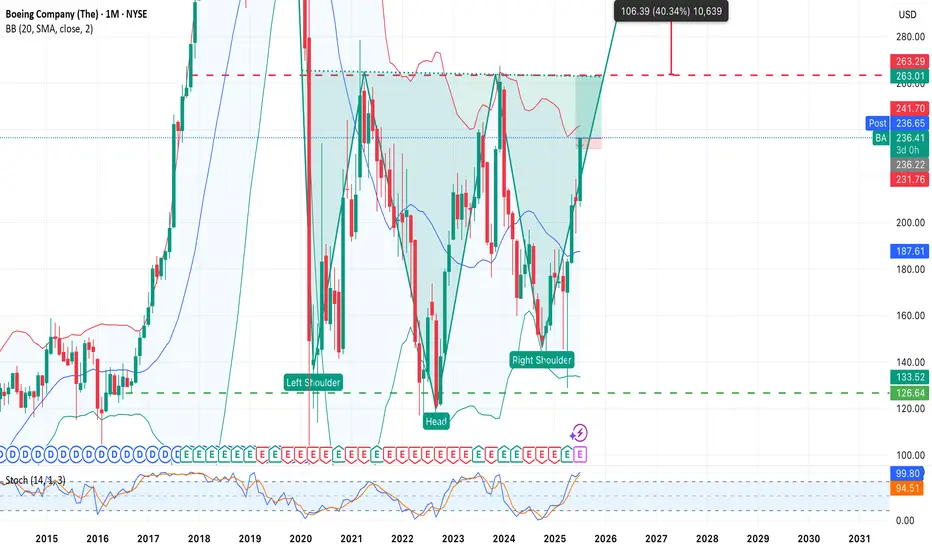
An inverted “Head and Shoulders” pattern is forming on the BA (Boeing) chart — one of the most reliable bullish formations in technical analysis. The price is confidently approaching the neckline around $235–241, and a breakout above this level could mark the beginning of a new upward momentum.
Pattern Parameters:
• Left Shoulder: ~$126
• Head: ~$99
• Right Shoulder: ~$126
• Neckline: ~$235
• Breakout Target:
➤ $235 + $136 = $371 (long-term)
➤ Nearest resistance: $263
Action Plan (if entering long):
• Entry: On breakout above $241 or on a retest of $235
• Stop: Below the right shoulder — $126–133 (depending on risk tolerance)
• Targets:
1. $263 — first technical target
2. $280+ — if the trend develops
3. $371 — full target based on the pattern (textbook scenario)😄
Disclaimer
The information and publications are not meant to be, and do not constitute, financial, investment, trading, or other types of advice or recommendations supplied or endorsed by TradingView. Read more in the Terms of Use.
Disclaimer
The information and publications are not meant to be, and do not constitute, financial, investment, trading, or other types of advice or recommendations supplied or endorsed by TradingView. Read more in the Terms of Use.