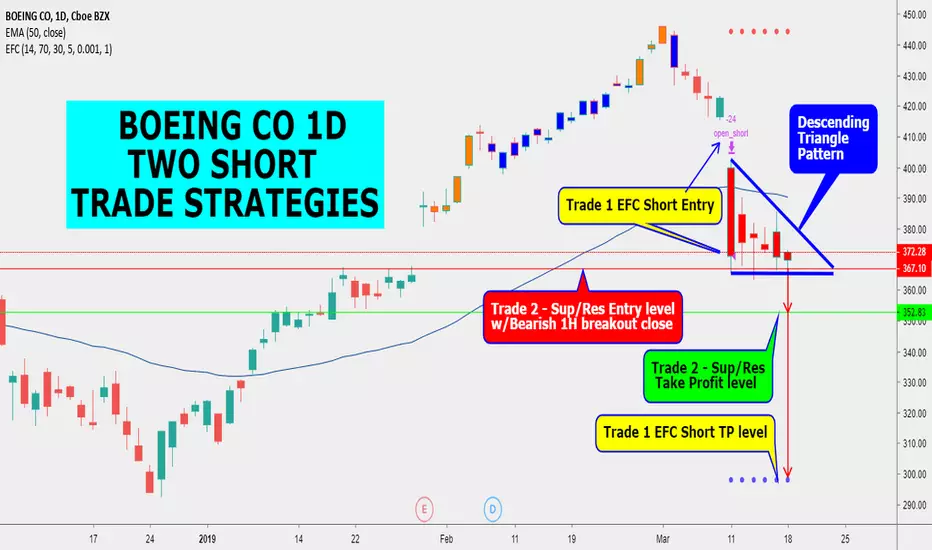
Price is in a descending triangle chart pattern
Bottom support triangle trendline @ 367.10
Trade 1 - EFC Indicator finds Entry and TP levels
Short Entry alert @ 372.28
EFC Take Profit level @ 300
Trade 2 - Breakout of Bottom Triangle Trendline @ 367.10
Enter with 1h breakout candle close
Sup/Res level Take Profit @ 352.83
Find your SL
Bottom support triangle trendline @ 367.10
Trade 1 - EFC Indicator finds Entry and TP levels
Short Entry alert @ 372.28
EFC Take Profit level @ 300
Trade 2 - Breakout of Bottom Triangle Trendline @ 367.10
Enter with 1h breakout candle close
Sup/Res level Take Profit @ 352.83
Find your SL
Disclaimer
The information and publications are not meant to be, and do not constitute, financial, investment, trading, or other types of advice or recommendations supplied or endorsed by TradingView. Read more in the Terms of Use.
Disclaimer
The information and publications are not meant to be, and do not constitute, financial, investment, trading, or other types of advice or recommendations supplied or endorsed by TradingView. Read more in the Terms of Use.