Alibaba Group Holdings Ltd ADR (BABA) has faced the ire of both the public and authorities in the past year and a half. In April 2020, users of the eponymous microblog of Alibaba-backed Weibo Corp complained that critical reports on the platform about an affair involving a top Alibaba executive had disappeared. And as recently as March, Alibaba was fined a record $2.75 billion for anti-competitive behavior. But the biggest retail sales provider is still with the most active consumers among the direct competitors (846 million) and also the most profitable Net profit margin company among competitors with 22.5%. For comparison, eBay and Amazon are respectively with 21.2% and 5.0%. Total cash flow operations growing by 112% YTD from the last year. But against the background of these data, the entire Chinese economy is under pressure due to fears about the Delta variant of COVID-19 and the result is that Alibaba's long downtrend.
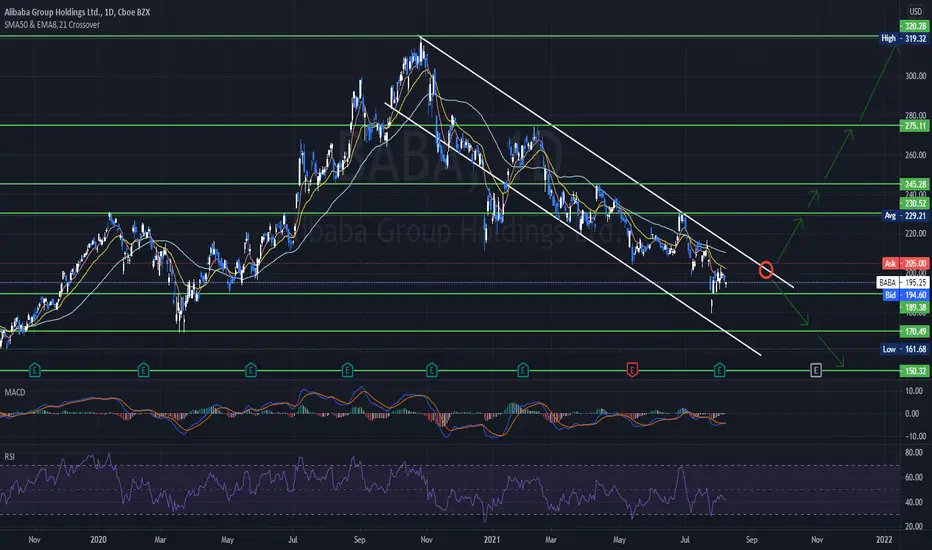
It has been in recovery mode since July 27th, when it hit support at 179.30. However, overall, the share price continues to print lower lows and lower highs below the downside resistance line drawn from the high of October 27th, which keeps the medium-term outlook negative. Even if the recovery continues for a while more, we will see decent chances for another round of selling from $200 levels. If so, we could see another test near $179.30 soon, the break of which would confirm a forthcoming lower low and may see scope for extensions towards the psychological prices of $150.00 area.
To start examining the bullish case though, we would like to see the rebound extending above the $200.00 zone, which is marked as resistance. This may also confirm the break above the aforementioned downside line and could initially target the $230-$246 area. If investors are not willing to stop there, then we could see advances towards the high at around $275.00 or more optimistic to test the previous high at $320 according to good yearly expectations results.
Taking a look at our oscillators indicators we see that MACD has crossed the triggered line and RSI rebounded from 30 levels.
Risk Disclosure: Trading Foreign Exchange (Forex) and Contracts of Difference (CFD's) carries a high level of risk. By registering and signing up, any client affirms their understanding of their own personal accountability for all transactions performed within their account and recognizes the risks associated with trading on such markets and on such sites. Furthermore, one understands that the company carries zero influence over transactions, markets, and trading signals, therefore, cannot be held liable nor guarantee any profits or losses.
Disclaimer
The information and publications are not meant to be, and do not constitute, financial, investment, trading, or other types of advice or recommendations supplied or endorsed by TradingView. Read more in the Terms of Use.
Disclaimer
The information and publications are not meant to be, and do not constitute, financial, investment, trading, or other types of advice or recommendations supplied or endorsed by TradingView. Read more in the Terms of Use.