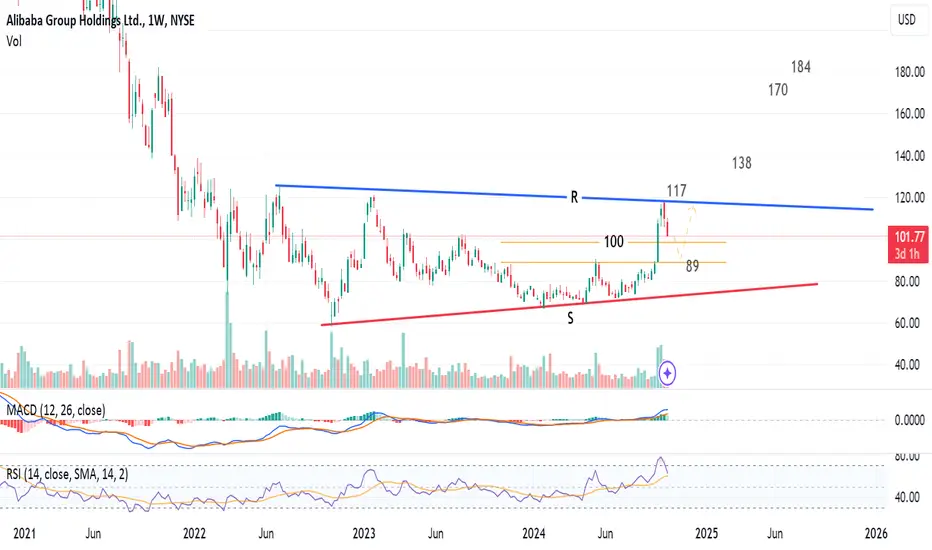
Weekly chart, the stock  BABA is trading in a symmetrical triangle, and is heading down to the support level.
I think the 100 or 89 levels will be strong enough to reverse the direction; to hit the resistance line R at around 117.
Closing above R for 2 weeks (above 118), the target will be 184, passing through the resistance levels 138 and 170
Consider the stop loss below 89
I think the 100 or 89 levels will be strong enough to reverse the direction; to hit the resistance line R at around 117.
Closing above R for 2 weeks (above 118), the target will be 184, passing through the resistance levels 138 and 170
Consider the stop loss below 89
Disclaimer
The information and publications are not meant to be, and do not constitute, financial, investment, trading, or other types of advice or recommendations supplied or endorsed by TradingView. Read more in the Terms of Use.
Disclaimer
The information and publications are not meant to be, and do not constitute, financial, investment, trading, or other types of advice or recommendations supplied or endorsed by TradingView. Read more in the Terms of Use.