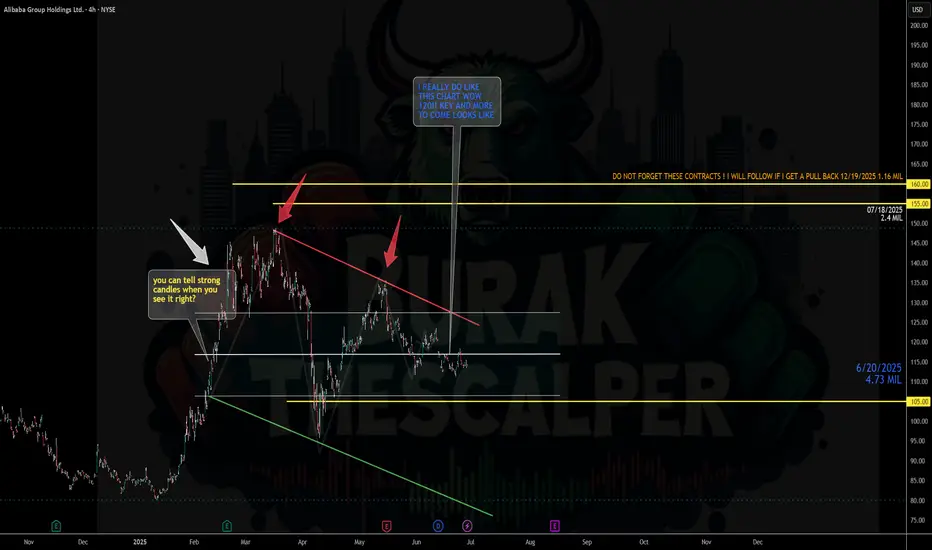
Bullish with short-term caution. Alibaba ( BABA) is at $114.08, up 0.13% daily but down 2.92% monthly, as shown in the finance card above. X posts reflect bullish sentiment, citing a breakout above the 200-week moving average and a potential move toward $168-$183.13, driven by strong AI/cloud growth (triple-digit AI revenue for seven quarters) and share repurchases (15.2M shares canceled in May 2025). Analysts rate it a "Strong Buy" with a $153.62 target (34.6% upside). However, technicals show resistance at $120.63-$123.90 and a bearish wave correction, with support at $113.32-$116.54. Tariff risks and a mixed options sentiment add volatility. A break above $120 could target $127; otherwise, a pullback to $113 is possible
Disclaimer
The information and publications are not meant to be, and do not constitute, financial, investment, trading, or other types of advice or recommendations supplied or endorsed by TradingView. Read more in the Terms of Use.
Disclaimer
The information and publications are not meant to be, and do not constitute, financial, investment, trading, or other types of advice or recommendations supplied or endorsed by TradingView. Read more in the Terms of Use.