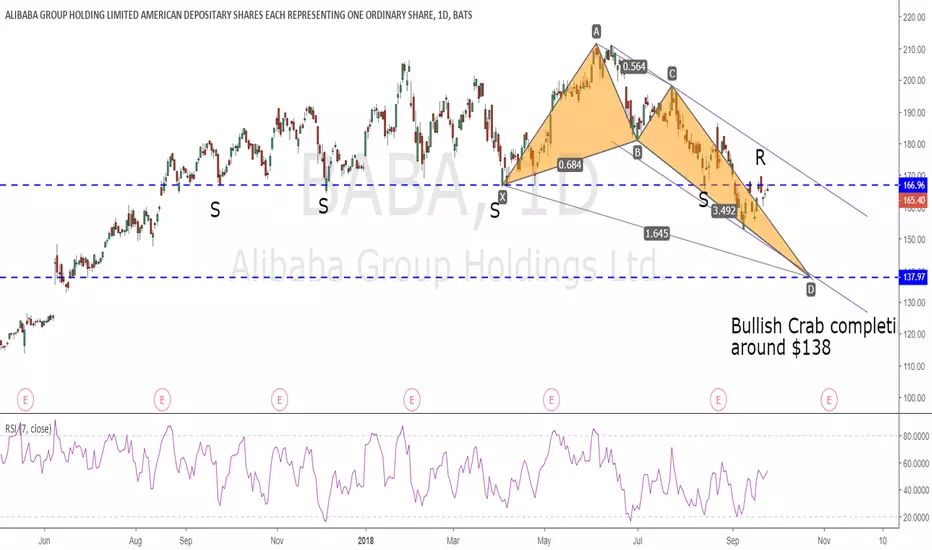
At this moment, the charts seems to be showing us that it is at a Support turned resistance zone.
I see price potentially dropping further to complete the Crab pattern at around the $138 levels.
Let's see where this goes.
I see price potentially dropping further to complete the Crab pattern at around the $138 levels.
Let's see where this goes.
Trade active
Actually I took a small trade as the price when down. Having a target of $138 for my short before I go long based on this chartTrade active
Here was where I shorted (at a resistance)Trade closed: target reached
Closed off my shorts !! Really nice move without much of a heart attack. Ladies and gentlemen..... I believe the stock market will be recovering for the coming next few days.Disclaimer
The information and publications are not meant to be, and do not constitute, financial, investment, trading, or other types of advice or recommendations supplied or endorsed by TradingView. Read more in the Terms of Use.
Disclaimer
The information and publications are not meant to be, and do not constitute, financial, investment, trading, or other types of advice or recommendations supplied or endorsed by TradingView. Read more in the Terms of Use.