hi Traders
Today we are analyzing Alibaba Group Holdings Ltd. (NYSE:BABA) on a 4hour chart basis.
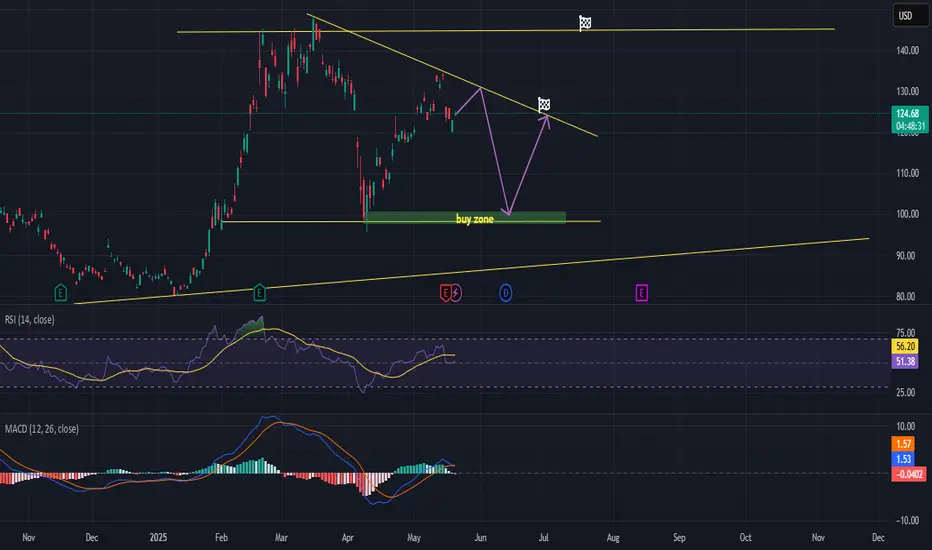
Alibaba stock is currently trading at $124
We expect that the price will get rejected at the downsloping resistance and in some time it will come back down to retest the support level around $100.
Following this event, we expect the price to bounce and move up towards the downsloping trendline (yellow line), which could be a take profit level.
$145 is the target.
This pattern (if continued) imitates a descending triangle.
We advise entering (buy) at this support line around $100. Be patient!
The stop loss can be placed around $95.
Good luck
Today we are analyzing Alibaba Group Holdings Ltd. (NYSE:BABA) on a 4hour chart basis.
Alibaba stock is currently trading at $124
We expect that the price will get rejected at the downsloping resistance and in some time it will come back down to retest the support level around $100.
Following this event, we expect the price to bounce and move up towards the downsloping trendline (yellow line), which could be a take profit level.
$145 is the target.
This pattern (if continued) imitates a descending triangle.
We advise entering (buy) at this support line around $100. Be patient!
The stop loss can be placed around $95.
Good luck
💥 Free signals and ideas ➡ t.me/vfinvestment
Disclaimer
The information and publications are not meant to be, and do not constitute, financial, investment, trading, or other types of advice or recommendations supplied or endorsed by TradingView. Read more in the Terms of Use.
💥 Free signals and ideas ➡ t.me/vfinvestment
Disclaimer
The information and publications are not meant to be, and do not constitute, financial, investment, trading, or other types of advice or recommendations supplied or endorsed by TradingView. Read more in the Terms of Use.