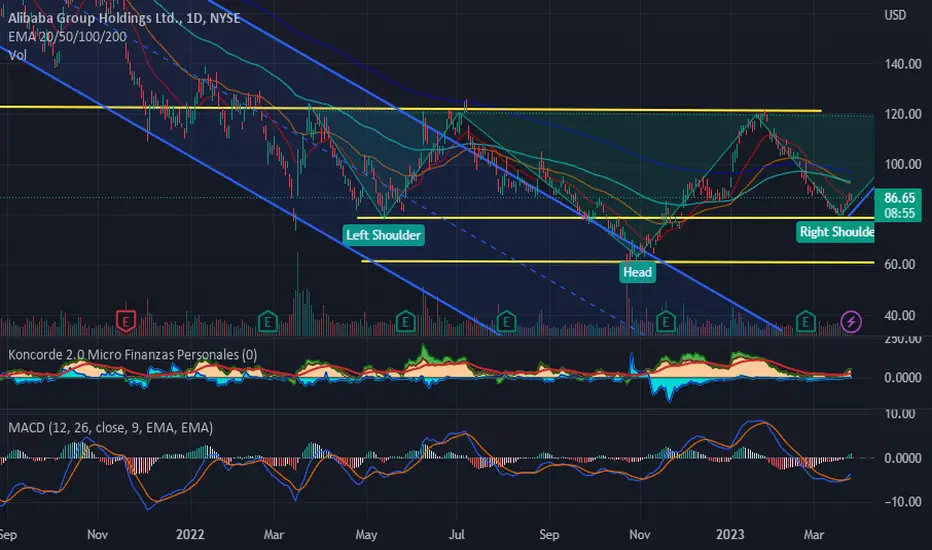
First Objective: $120
The head and shoulders chart pattern is a popular and easy-to-spot pattern in technical analysis that shows a baseline with three peaks, the middle peak being the highest. The head and shoulders chart depicts a bullish-to-bearish trend reversal and signals that an upward trend is nearing its end.
The head and shoulders chart pattern is a popular and easy-to-spot pattern in technical analysis that shows a baseline with three peaks, the middle peak being the highest. The head and shoulders chart depicts a bullish-to-bearish trend reversal and signals that an upward trend is nearing its end.
Disclaimer
The information and publications are not meant to be, and do not constitute, financial, investment, trading, or other types of advice or recommendations supplied or endorsed by TradingView. Read more in the Terms of Use.
Disclaimer
The information and publications are not meant to be, and do not constitute, financial, investment, trading, or other types of advice or recommendations supplied or endorsed by TradingView. Read more in the Terms of Use.