The pattern is bearish for the short term, but can be bullish down the road.
For bearish traders, the trend is your friend (until it's not) and the stock is likely to continue downwards. Aggressive traders may decide to short the stock at the upper trendline and exit the trade at the lower trendline.
Bullish traders will want to watch for a break up from the upper descending trendline, on high volume, for an entry. When a stock breaks up from a descending channel, it's a powerful reversal signal and indicates a rally is likely in the cards.
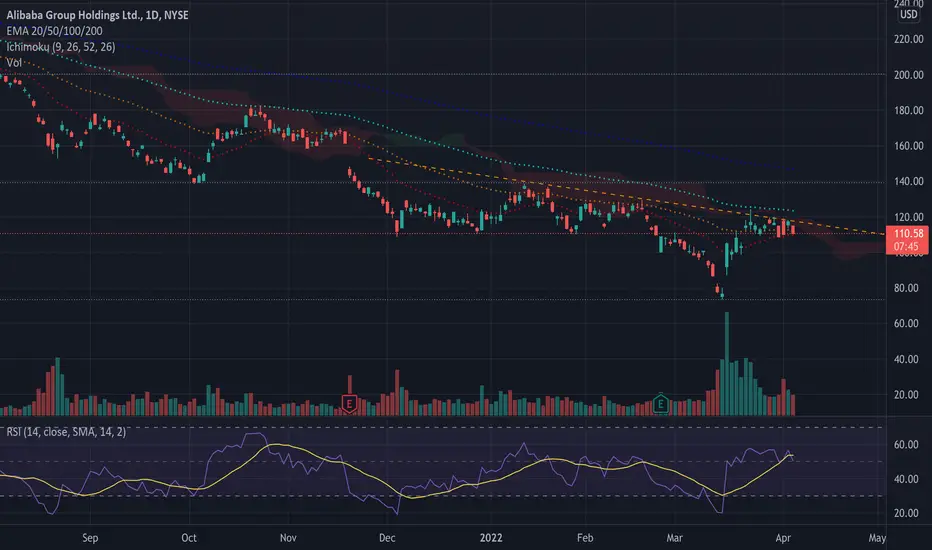
Between March 15 and March 23, Alibaba soared 70% higher, but has since dropped into a falling channel pattern on the daily chart. Within the pattern, Alibaba has made a consistent series of lower highs and lower lows, with the most recent lower low printed on March 31 at $108.71 and the most recent lower high created at the $118.22 level on Monday.
It should be noted that the current falling channel on the daily chart could form into the flag formation of a weekly bull flag pattern.
Traders and investors can watch for a break up from the falling channel on higher-than-average volume to indicate a reversal is in the cards. If the stock breaks up from the pattern, the measured move of the weekly bull flag indicates Alibaba could trade up toward the $185 level.
The decline on Tuesday was on lower-than-average volume, which indicates consolidation rather than fear. By early afternoon, only about 20 million Alibaba shares had exchanged hands, compared to the 10-day average of 48.08 million.
There's a gap below on Alibaba’s chart between $80.14 and $87.12, which may give bullish traders pause because gaps on charts are about 90% likely to fill. There are also three gaps above on Alibaba’s chart that are also likely to fill in the future, with the highest gap ranging up near the $220 level.
Alibaba has resistance above at $121.95 and $130 and support below at $110.06 and $104.44.
For bearish traders, the trend is your friend (until it's not) and the stock is likely to continue downwards. Aggressive traders may decide to short the stock at the upper trendline and exit the trade at the lower trendline.
Bullish traders will want to watch for a break up from the upper descending trendline, on high volume, for an entry. When a stock breaks up from a descending channel, it's a powerful reversal signal and indicates a rally is likely in the cards.
Between March 15 and March 23, Alibaba soared 70% higher, but has since dropped into a falling channel pattern on the daily chart. Within the pattern, Alibaba has made a consistent series of lower highs and lower lows, with the most recent lower low printed on March 31 at $108.71 and the most recent lower high created at the $118.22 level on Monday.
It should be noted that the current falling channel on the daily chart could form into the flag formation of a weekly bull flag pattern.
Traders and investors can watch for a break up from the falling channel on higher-than-average volume to indicate a reversal is in the cards. If the stock breaks up from the pattern, the measured move of the weekly bull flag indicates Alibaba could trade up toward the $185 level.
The decline on Tuesday was on lower-than-average volume, which indicates consolidation rather than fear. By early afternoon, only about 20 million Alibaba shares had exchanged hands, compared to the 10-day average of 48.08 million.
There's a gap below on Alibaba’s chart between $80.14 and $87.12, which may give bullish traders pause because gaps on charts are about 90% likely to fill. There are also three gaps above on Alibaba’s chart that are also likely to fill in the future, with the highest gap ranging up near the $220 level.
Alibaba has resistance above at $121.95 and $130 and support below at $110.06 and $104.44.
Disclaimer
The information and publications are not meant to be, and do not constitute, financial, investment, trading, or other types of advice or recommendations supplied or endorsed by TradingView. Read more in the Terms of Use.
Disclaimer
The information and publications are not meant to be, and do not constitute, financial, investment, trading, or other types of advice or recommendations supplied or endorsed by TradingView. Read more in the Terms of Use.