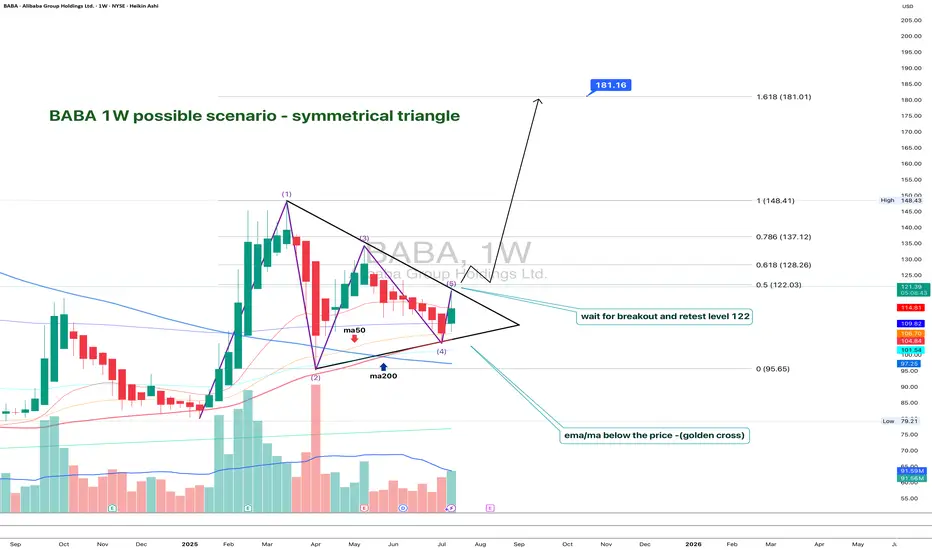
On the weekly chart, BABA has already formed a golden cross - price is above both MA50 and MA200, confirming a bullish trend shift. The stock is now approaching the upper edge of the symmetrical triangle and the key resistance at $122, which also aligns with the 0.5 Fibonacci level.
The numbers inside the triangle represent the contraction phases, not Elliott waves. This is a classical consolidation before a potential breakout. If the $122 level is broken and retested, upside targets are $128 (0.618), $137 (0.786), and eventually $148–181 (1.0–1.618 extension).
Volume is rising, MACD is flipping bullish, and RSI is climbing out of oversold territory — all signs point to growing bullish momentum.
Fundamentally, Alibaba benefits from China's economic rebound, possible regulatory relief, and ongoing share buybacks. With Chinese tech rotating back into favor, BABA could lead the rally.
So if you're still waiting for a signal - it's already here. The golden cross is done, price is flying above moving averages, and all that’s left is a clean breakout. Watch $122 — that’s the launchpad.
Note
Alibaba has introduced its new model, Qwen‑Image, and in my opinion, this is a significant milestone for the entire field of generative AI. This isn’t just another image generator — it's a powerful tool designed to solve one of the most complex challenges in visual AI: rendering and editing text inside images. Qwen‑Image is built on the MMDiT architecture with 20 billion parameters and is integrated directly into Qwen Chat. Anyone can try it out now by selecting the "Image Generation" option in the interface.What sets Qwen‑Image apart from existing tools? First and foremost, its exceptional text rendering accuracy. The model can generate multi-line layouts, preserve paragraph structure, maintain stylistic consistency, and ensure visual readability. And it’s not limited to alphabet-based languages — it handles logographic languages like Chinese with equally impressive precision. Another key feature is sequential image editing. Thanks to its multi-task learning approach, the model retains both semantic meaning and visual quality when applying changes: you can modify text, adjust styles or poses, remove or add elements.
Alibaba benchmarked Qwen‑Image against various public tests such as GenEval, GEdit, OneIG‑Bench, LongText‑Bench, and more. It consistently ranked among the top performers, especially in text rendering tasks, where most AI systems still fall short. Demo examples confirm this: the model renders complex Chinese characters on signage with accurate depth of field, produces clean English titles in book layouts, and formats bilingual informational content properly.
It’s important to understand why Alibaba is focusing on this kind of functionality. Much of today’s visual AI content still struggles with handling text — it’s often blurry, cropped, or unreadable. So, any system that solves this problem effectively gains a practical edge. Industries like marketing, design, packaging, web layout, and educational content all benefit directly from this advancement.
Alibaba also emphasizes its commitment to an open ecosystem by inviting developers and researchers to contribute. That’s a key point — the company isn’t just building a closed product for its own use, but offering a tool for the broader community to improve and adapt for real-world applications.
All in all, the launch of Qwen‑Image is a strong move. It marks a shift from the race for larger models toward actual usability and quality in areas where others still lag behind. I believe we’ll soon see this model integrated into enterprise and educational platforms — and not just in China.
Trade active
#BABA +20% - trade in progress - targets at 148 and 181 - if desired, you can lock in part of the position 👨🎓 Наш телеграм t.me/totoshkatrading
🉐 Платформы linktr.ee/totoshka55
💬 Наши контакты @Totoshkatips
🔗 Сайт totoshkatrades.com
🉐 Платформы linktr.ee/totoshka55
💬 Наши контакты @Totoshkatips
🔗 Сайт totoshkatrades.com
Disclaimer
The information and publications are not meant to be, and do not constitute, financial, investment, trading, or other types of advice or recommendations supplied or endorsed by TradingView. Read more in the Terms of Use.
👨🎓 Наш телеграм t.me/totoshkatrading
🉐 Платформы linktr.ee/totoshka55
💬 Наши контакты @Totoshkatips
🔗 Сайт totoshkatrades.com
🉐 Платформы linktr.ee/totoshka55
💬 Наши контакты @Totoshkatips
🔗 Сайт totoshkatrades.com
Disclaimer
The information and publications are not meant to be, and do not constitute, financial, investment, trading, or other types of advice or recommendations supplied or endorsed by TradingView. Read more in the Terms of Use.