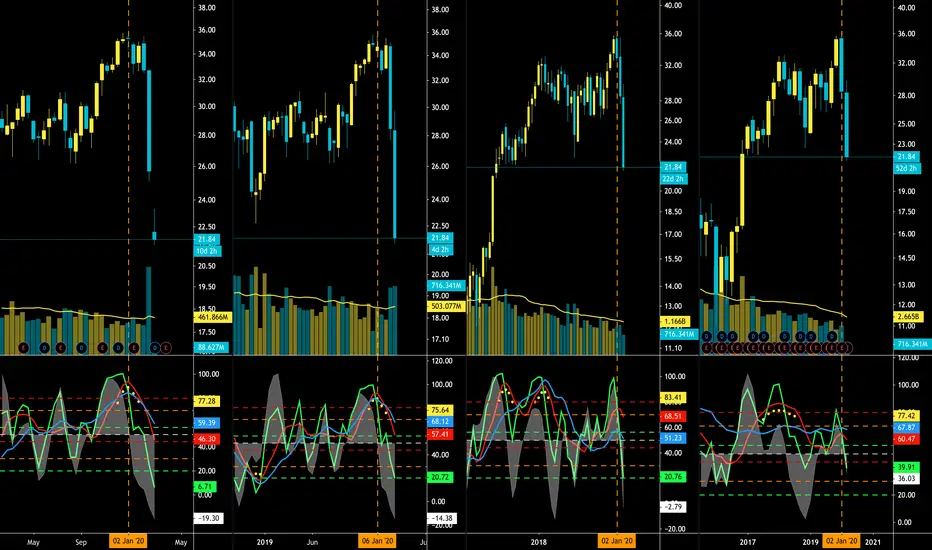
9-Day (Far Left); 2-Week (Left of Center); 1-Month (Right of Center); 2-Month (Far Right):
9-Day: It was looking rather bleak for BOA in this 9-Day TF that began January 2, 2020 when the Green Line turned down and the Red RSI made contact with the Green Line WHILE the Green Line was going down; indicating downward pressure. Not only that; the White Energy was already heading down, the Green Line and Red RSI made their contact ABOVE the 80% level (showing it was likely exhausted). ALSO: The Green Line and White Energy in the Monthly TF on January, 2020 had both peaked above 80 percent and turned down. The same thing occurred with the 2-Month TF that began January, 2020.
2-Week: Later on January 6, 2020 we had a new 2-Week Candle with the Green Line turning down and the Red RSI making contact with the Green Line WHILE the Green Line was going down; indicating downward pressure. We also saw a repetition of the 9-Day TF in this 2-Week TF when the White Energy was already heading down, the Green Line and Red RSI made their contact ABOVE the 80% level (showing it was likely exhausted).
This is not looking good. We should expect the FED to likely lower rates at least another 0.5% and begin quantitative easing. This will allow us to have a bounce but I would be surprised if this bounces back up to $35 ever again due to what's going on with the Corona Virus. Supply Chains have been severely hit. Which affects corporations ability to make payments on loans provided by BOA. All other large banks are running into similar issues. This may get very nasty.
Note
Disclaimer
The information and publications are not meant to be, and do not constitute, financial, investment, trading, or other types of advice or recommendations supplied or endorsed by TradingView. Read more in the Terms of Use.
Disclaimer
The information and publications are not meant to be, and do not constitute, financial, investment, trading, or other types of advice or recommendations supplied or endorsed by TradingView. Read more in the Terms of Use.