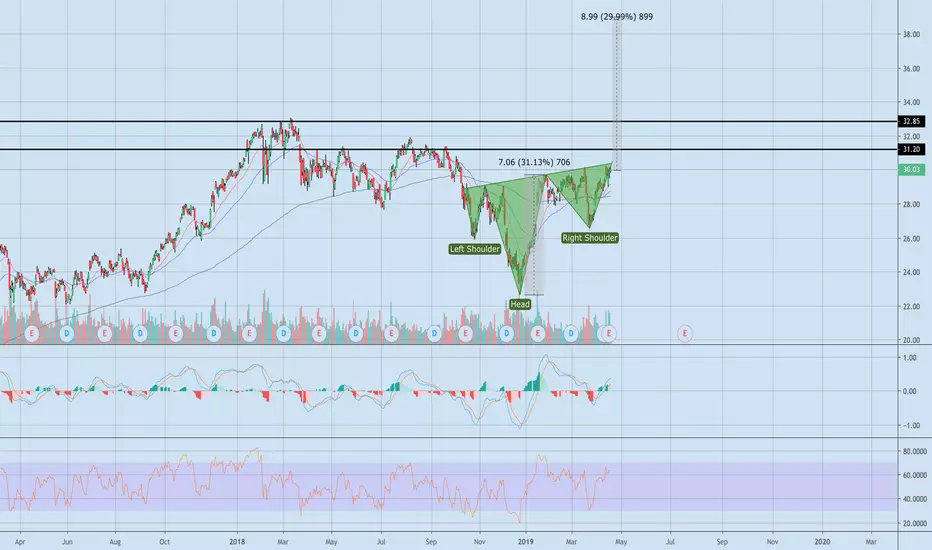
Inverse Head and Shoulders on the weekly / daily  BACBAC chart.
I would probably wait forBAC to rise above $30.5 -$31 before entering into a long position.
IfBAC sees $31 then the first target is $32, and the last target is $35 (although I find this hard to believe to be honest).
Something to consider: WFC Wells Fargo has a Head and Shoulders pattern on weekly / daily. These two stocks appear to rise and dip at similar times due to both being banks (no shit).
Like always, open to constructive criticism.
Thanks for visiting.
I would probably wait for
If
Something to consider:
Like always, open to constructive criticism.
Thanks for visiting.
Note
First target hit. BTW my
Related publications
Disclaimer
The information and publications are not meant to be, and do not constitute, financial, investment, trading, or other types of advice or recommendations supplied or endorsed by TradingView. Read more in the Terms of Use.
Related publications
Disclaimer
The information and publications are not meant to be, and do not constitute, financial, investment, trading, or other types of advice or recommendations supplied or endorsed by TradingView. Read more in the Terms of Use.