Chart Type: Daily (1D)
Current Price: ₹8,455
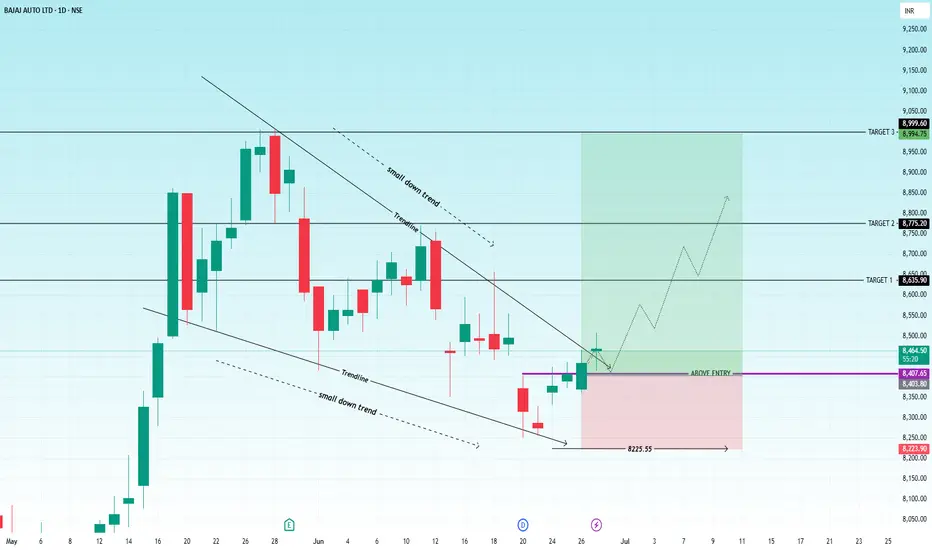
Structure: Falling wedge breakout with defined targets
Falling Wedge Formation:
The price has been consolidating within a falling wedge pattern, indicating a potential bullish reversal.
Both upper and lower trendlines (labeled as "small down trend") have been respected multiple times, validating the structure.
Breakout Confirmation:
A breakout above the descending trendline has occurred, accompanied by a bullish candle closing above the immediate resistance zone around ₹8,407.
This marks the breakout point and indicates a shift in momentum.
Support Zone:
Strong support has been established near ₹8,225.55, as marked on the chart.
This level can serve as a stop-loss for bullish positions.
-----
BUY: above 8410-8450
SUPPORT ( SL ) : 8220
RESISTANCE ( TGT) :8640-8780-9000+++
Disclaimer
The information and publications are not meant to be, and do not constitute, financial, investment, trading, or other types of advice or recommendations supplied or endorsed by TradingView. Read more in the Terms of Use.
Disclaimer
The information and publications are not meant to be, and do not constitute, financial, investment, trading, or other types of advice or recommendations supplied or endorsed by TradingView. Read more in the Terms of Use.