Long
Balancer (BAL) - Higher lows
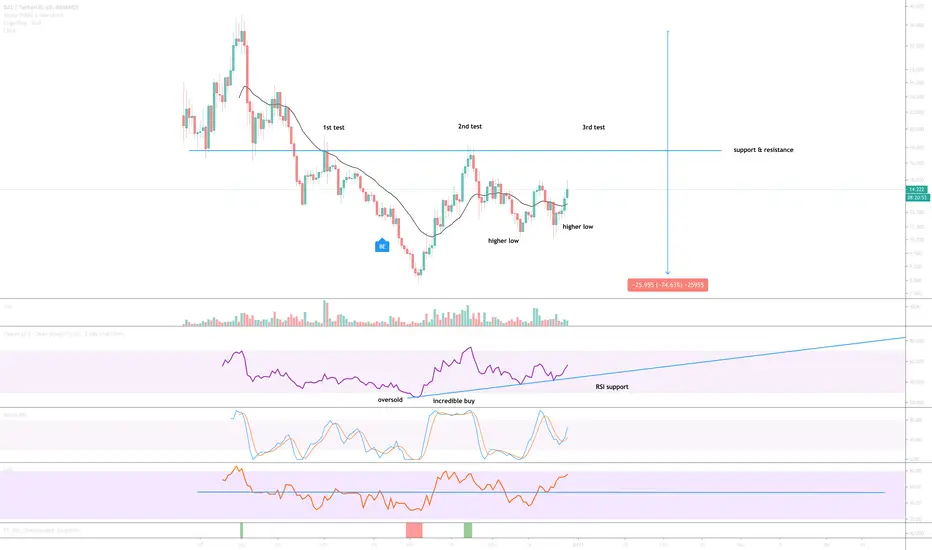
Following a 70% correction (now 50%) and oversold condition, price action on the above 1-day chart is now printing a strong trend reversal. The higher lows in price action are also mirrored by the oscillators with higher highs in RSI and Stochastic RSI. Very bullish.
1st target $27
Should RSI support remain active (blue line) after target price is met then price action is expected to be in uptrend until mid-2021.
The weekly chart (below) printed a long tailed Dragonfly DOJI indicating strong buying pressure in the weeks ahead.

1st target $27
Should RSI support remain active (blue line) after target price is met then price action is expected to be in uptrend until mid-2021.
The weekly chart (below) printed a long tailed Dragonfly DOJI indicating strong buying pressure in the weeks ahead.
Trade active
3-day chart below printed a higher low on Stochastic RSI above 40 - very bullish in the near term in combination with the above chart.Trade active
3rd time lucky! Resistance convincingly smashed. Should today's candle close as it currently is a much stronger move to the upside should be expected. RSI is currently overbought however Stochastic RSI is above 80, can only be bullish as long as that remains.Note
Resistance broken. What I expect to occur next is a test of target before support confirmation:Trade active
Lot of energy with the close of last week's candle - the length of the tail suggests buyers were in abundance.Note
Target reached - Banana! BTC
bc1q2eckdzh0q8vsd7swcc8et6ze7s99khhxyl7zwy
Weblink: patreon.com/withoutworries
Allow 3-6 months on ideas. Not investment advice. DYOR
bc1q2eckdzh0q8vsd7swcc8et6ze7s99khhxyl7zwy
Weblink: patreon.com/withoutworries
Allow 3-6 months on ideas. Not investment advice. DYOR
Disclaimer
The information and publications are not meant to be, and do not constitute, financial, investment, trading, or other types of advice or recommendations supplied or endorsed by TradingView. Read more in the Terms of Use.
BTC
bc1q2eckdzh0q8vsd7swcc8et6ze7s99khhxyl7zwy
Weblink: patreon.com/withoutworries
Allow 3-6 months on ideas. Not investment advice. DYOR
bc1q2eckdzh0q8vsd7swcc8et6ze7s99khhxyl7zwy
Weblink: patreon.com/withoutworries
Allow 3-6 months on ideas. Not investment advice. DYOR
Disclaimer
The information and publications are not meant to be, and do not constitute, financial, investment, trading, or other types of advice or recommendations supplied or endorsed by TradingView. Read more in the Terms of Use.