Long
Balancer (BAL) - Falling wedge breakout
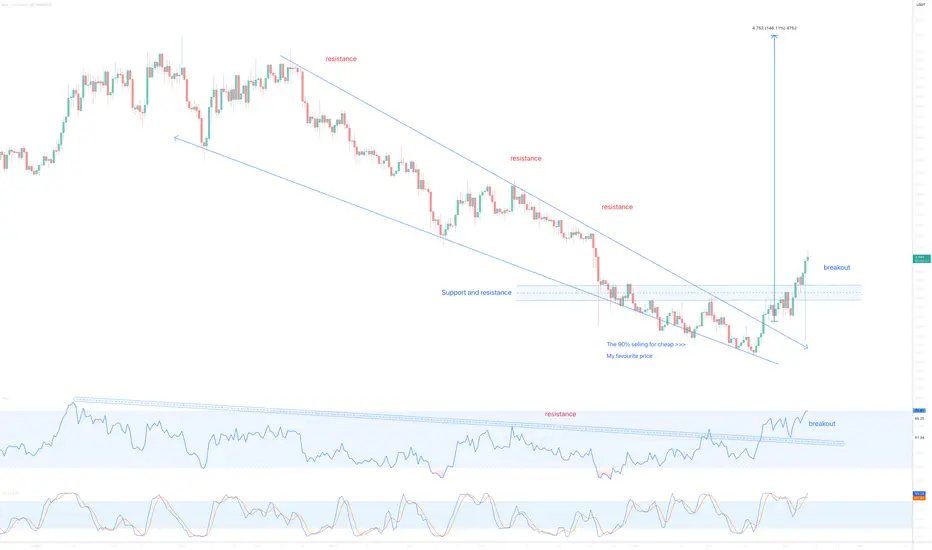
On the above daily chart price action has corrected 60% since the year began. A number of reasons now exist to consider a long position, including:
1) Price action and RSI resistance breakouts. The trend has reversed.
2) Price action prints a bullish engulfing candle on past resistance followed by a hammer candle. What a chart.
3) The falling wedge measures a 140% reward.
Is it possible price action falls further? Sure.
It is probable? No.
Ww
Type: trade
Risk: <=6%
Timeframe to act: now
Return: 100% to start
Trade active
BTC
bc1q2eckdzh0q8vsd7swcc8et6ze7s99khhxyl7zwy
Weblink: patreon.com/withoutworries
Allow 3-6 months on ideas. Not investment advice. DYOR
bc1q2eckdzh0q8vsd7swcc8et6ze7s99khhxyl7zwy
Weblink: patreon.com/withoutworries
Allow 3-6 months on ideas. Not investment advice. DYOR
Disclaimer
The information and publications are not meant to be, and do not constitute, financial, investment, trading, or other types of advice or recommendations supplied or endorsed by TradingView. Read more in the Terms of Use.