Long
BAL USDT (Long Trade Setup)
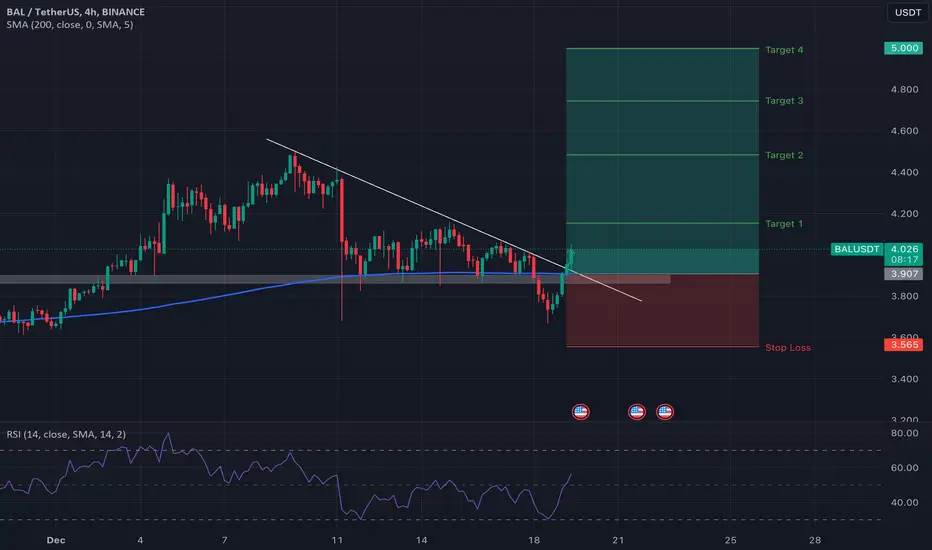
Technical Analysis behind BAL USDT trade:
1. Trendline Breakout & Supported by the immediate support area.
2. Three White Soldiers Candlestick pattern formed, a bullish sign.
3. Supported by the 200 Days SMA.
4. RSI is at 60, a bullish sign.
5. Volume & Momentum analysis also supports the trade.
6. The stop loss is based on the volatility indicator (ATR)
Disclaimer
The information and publications are not meant to be, and do not constitute, financial, investment, trading, or other types of advice or recommendations supplied or endorsed by TradingView. Read more in the Terms of Use.
Disclaimer
The information and publications are not meant to be, and do not constitute, financial, investment, trading, or other types of advice or recommendations supplied or endorsed by TradingView. Read more in the Terms of Use.