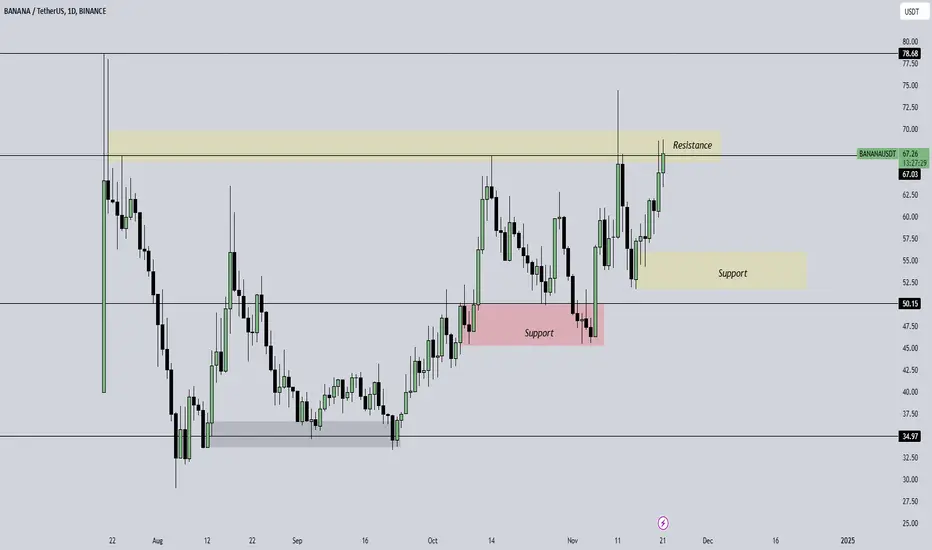
### 📊 **Current Price: 67.17**
- BANANA coin is currently at **67.17**, which places it in an important price zone. This price level is crucial to watch closely for any signs of a breakout or breakdown.
---
### 🔨 **Resistance Levels: 78.72**
- The **78.72** level represents an **important resistance zone**. Resistance is where the price tends to face selling pressure, making it harder for the price to move higher.
- **Why this is significant**: For BANANA to continue its upward movement, it needs to break through the **78.72** resistance level. However, as you mentioned, breaking through this level is likely to be a "difficult road map." The market may experience some struggles here due to previous sellers at this price point.
---
### 🔄 **Key to Success: Break and Retest Resistance**
- **Break and Retest**: This is a critical trading concept. Once the price breaks through resistance, it often comes back to test that level again to confirm that it has become new support.
- **Example**: If the price rises above **78.72**, it may retrace back down to that level (or slightly lower) before continuing upward. This "retest" helps to confirm that the breakout is valid and not a false signal.
- **Why this matters**: If the price fails to retest and hold above the broken resistance, it might indicate weakness, and the price could drop back below resistance, which could lead to a reversal or continued consolidation.
---
### 📉 **Support Levels: 54.35 / 48.00 / 42.34**
- **Support levels** are crucial for identifying potential price floors where the market might find buying interest. If the price falls below the current level of **67.17**, the following support zones can provide critical price points to monitor for potential reversals:
1. **54.35**: A strong potential support level where buying interest might show up, preventing the price from dropping further.
2. **48.00**: Another support level where there could be buying pressure if the price falls lower.
3. **42.34**: The lowest support you’ve identified, which could act as the final line of defense for the price before a significant downward move.
---
### 🛣️ **Price Scenario Breakdown**
- **Scenario 1: Price Holds Above 67.17**
- If the price holds at **67.17** or rises above, the next goal is to break through **78.72**. Once this resistance is breached and retested, the potential for an upward trend increases, but patience is key.
- **Scenario 2: Price Fails to Hold 67.17**
- If the price fails to hold **67.17** and starts moving downward, watch for a potential test of the **54.35** support level. If this level doesn't hold, the price may drop further, testing **48.00** and **42.34**.
---
### 💡 **Conclusion: What to Watch For**
- **Breaking Resistance (78.72)**: The key level to watch is **78.72**. If the price can break this resistance level and then successfully retest it, the market might continue upwards. This breakout confirmation is essential for the continuation of the bullish move.
- **Falling Below Support**: If the price fails to hold **67.17** and falls toward the support zones, the **54.35**, **48.00**, and **42.34** levels will be critical. If those levels fail, further downside risk could occur.
### 🚨 **Reminder**:
This analysis is not financial advice! Always perform your own research and use proper risk management in your trades. Markets can be volatile and unpredictable.
Disclaimer
The information and publications are not meant to be, and do not constitute, financial, investment, trading, or other types of advice or recommendations supplied or endorsed by TradingView. Read more in the Terms of Use.
Disclaimer
The information and publications are not meant to be, and do not constitute, financial, investment, trading, or other types of advice or recommendations supplied or endorsed by TradingView. Read more in the Terms of Use.