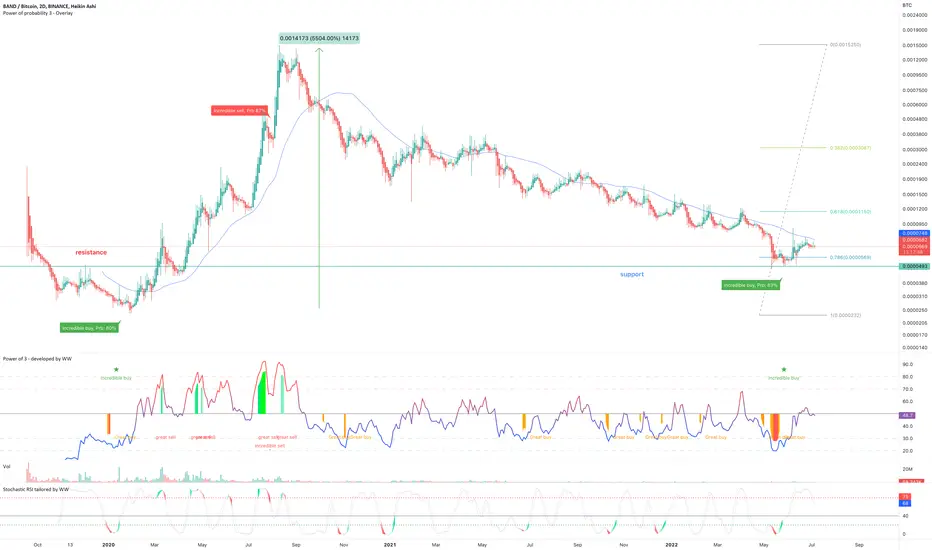
On the above 2-day chart price action has corrected 90% since the sell signal back in July 2020 following a massive 5500% from the buy signal in January 2020. A number of reasons now exist to be bullish, including:
1) Really? You don’t see it?!
2) Price action has corrected to the 0.786 Fibonacci level, which is also support on past resistance. Look left.
3) Regular bullish divergence. Multiple oscillators are currently printing bullish divergence with price action. It is clearer to see on the 1-day USD chart below.
4) On 'what if' list.
Is it possible price action falls further? For sure.
Is it probable? Very unlikely.
Ww
1-day USD chart bullish divergence

Type: trade
Risk: <=6% of portfolio
Timeframe: 3 to 6 months
Return: 20x
1) Really? You don’t see it?!
2) Price action has corrected to the 0.786 Fibonacci level, which is also support on past resistance. Look left.
3) Regular bullish divergence. Multiple oscillators are currently printing bullish divergence with price action. It is clearer to see on the 1-day USD chart below.
4) On 'what if' list.
Is it possible price action falls further? For sure.
Is it probable? Very unlikely.
Ww
1-day USD chart bullish divergence
Type: trade
Risk: <=6% of portfolio
Timeframe: 3 to 6 months
Return: 20x
Trade active
Note
These signals are fantastic.This is the 10-day dollar chart. What you now see is a hammer candle, they are a leading indicator of the momentum that is about to be seen over the coming weeks.Unfortunately not alt-tokens are printing such candles. If I find the time..
Trade active
nudge nudge wink winkNote
I don't try to time bottoms, but when I do...Trade active
But when I do....Note
Probably a good moment - Past resistance confirmed as support.Trade active
Higher low on the golden pocket that also happens to be past resistance, perfect.Trade active
Do you see? Did you see what printed??Trade active
"Did you see?" now confirmed.If you read those words on an idea I've updated, pay attention ;-)
Note
** Swing trade opportunity **Do not ignore. Price action is well outside the Bollinger Band on the daily. Remember 95% of all candles trade inside the band, which is 1100 sats.
On the lower time frames a strong sell signal has printed. Look for support around 700 sats in the first instance or if you’re a Patron, wait for a new buy signal to print.
BTC
bc1q2eckdzh0q8vsd7swcc8et6ze7s99khhxyl7zwy
Weblink: patreon.com/withoutworries
Allow 3-6 months on ideas. Not investment advice. DYOR
bc1q2eckdzh0q8vsd7swcc8et6ze7s99khhxyl7zwy
Weblink: patreon.com/withoutworries
Allow 3-6 months on ideas. Not investment advice. DYOR
Related publications
Disclaimer
The information and publications are not meant to be, and do not constitute, financial, investment, trading, or other types of advice or recommendations supplied or endorsed by TradingView. Read more in the Terms of Use.