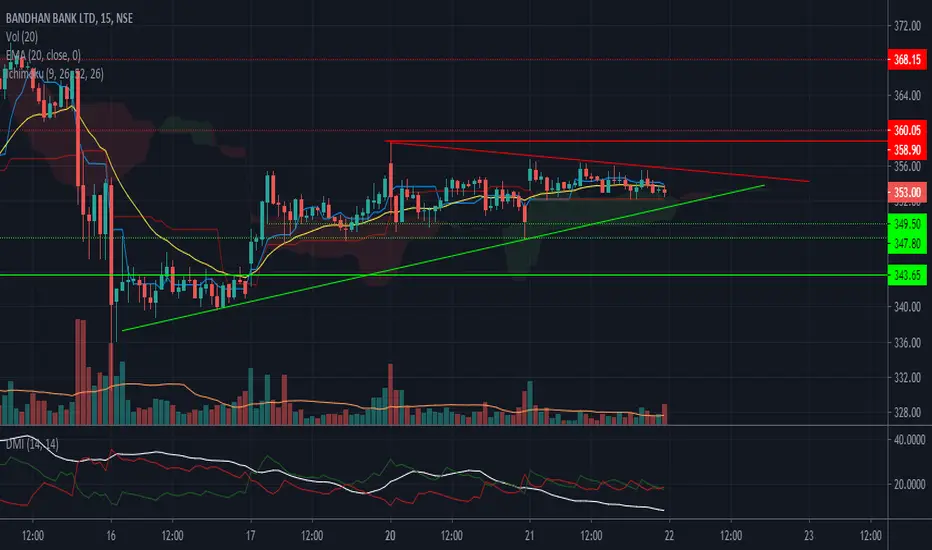
#BANDHANBANK after QoQ result stock was falling but got the support over 20EMA. Forming the symmetrical triangle pattern on 15 min Chart.
Showing Bullish result in Technical Parameter:
CCI is treading UP
RSI is treading UP
Stoch %k crossed above %D
DI+ is treading above DI-
Got support over Bolinger Band mid line
ATR is decreasing and now below 20
Short cover
----------------------------------------------------------
Support : 347.80 and 343.65
Breakdown : 349.50
LTP : 353
Breakout : 366
Short Target : 359 and 368
----------------------------------------------------------
Positive & Negative Point:
1) Neutral in Daily/Weekly and bearish in monthly chart
----------------------------------------------------------
(Disclaimer: This is only for educational purpose and paper treading.)
Trade closed: target reached
Hit the Bottom Target 343.65Disclaimer
The information and publications are not meant to be, and do not constitute, financial, investment, trading, or other types of advice or recommendations supplied or endorsed by TradingView. Read more in the Terms of Use.
Disclaimer
The information and publications are not meant to be, and do not constitute, financial, investment, trading, or other types of advice or recommendations supplied or endorsed by TradingView. Read more in the Terms of Use.