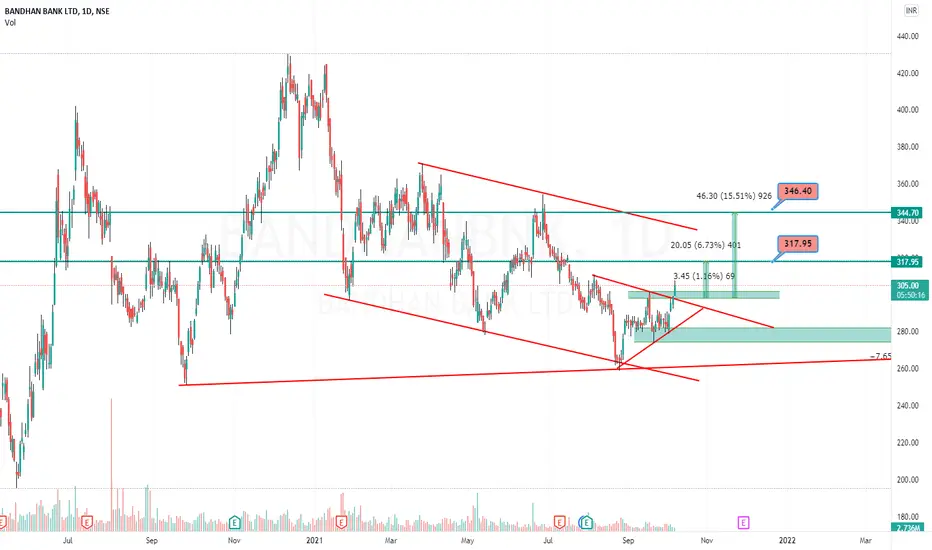
Stock Analysis: Bandhan Bank has formed falling channel and sym triangle pattern it looks good buy around marked demand area with below level as stop loss for the given target let's see..
Happy Invesing!
Happy Invesing!
Trade active
Target 1 doneTrade closed: target reached
Disclaimer
The information and publications are not meant to be, and do not constitute, financial, investment, trading, or other types of advice or recommendations supplied or endorsed by TradingView. Read more in the Terms of Use.
Disclaimer
The information and publications are not meant to be, and do not constitute, financial, investment, trading, or other types of advice or recommendations supplied or endorsed by TradingView. Read more in the Terms of Use.