Observations::
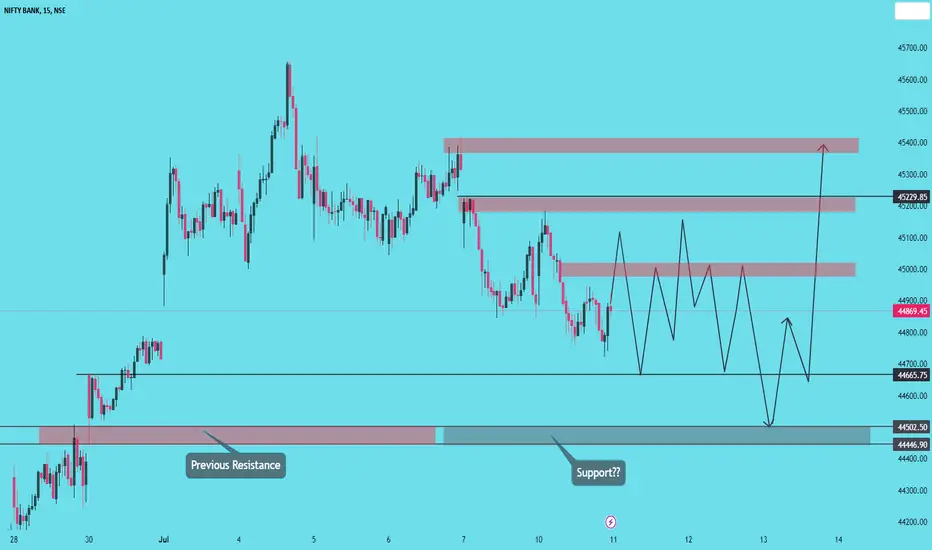
the previous resistance @44500 level is broken by opening a huge gap up
then price is immediately testing the resistance with a single red candle...
tomorrow this red candle...won't allow the price to go down...
but price wants to fill the small gap up....which is left almost 55-60 points gap..
if we see from top price is continuously falling...from 45600 levels...
if tomorrow price wants to fill this gap....and big red candle rejecting the price downwards..
and above we have strong demand acts as resistance again...
considering all these 3 points results in a consolidation market...
in which levels these consolidation takes place...i.e from 45000-44650 levels....
what happens if price starts consolidation...
if price consolidates to test the previous resistance...
which indicates a bullishness again from 44500 levels...
if a continuous falling happens price will again test the 44000-44100 levels.
All this is a pre- post market analysis, live market is entirely different from these analysis...
will see on live market what happens.
Note
Price is at our POI for sell...wait for confirmation.Note
broken the trendline as well...but need for retest...to go long..mostly fake out happens..Note
its clear...rejections...wait for a pullback Note
Note
we are always safe traders...so we have gap below..after completion ...again gives pullback then will again enter ...Note
If i want to golong....it has to move strong to upside...and gives me some pullback then only up...Note
consolidation starts....it is moving up and downs...no proper targets..only Sl hit program is initiated.Be careful at every level.. Note
price broken...with consolidation...chance of going down...will wait until small trendline to be break and retest.
Note
No proper momentum...after break and retest also...Note
price is taking multiple times rejection from the same level...it can give breakout on an side...Note
i am taking more confluence...price broken trendline on bottom side..if failed then only..
and again taking the help of upper trendline continuation...
Note
price again proven that a sign of bearishness....Price broken our POI for sell,moving slowly to the upside...
broken the trendline..in smaller time frame and fall back...no oppurtunity to enter long...
today we have a major trendline if this trendline again acts as resistance...it will again fall back..
the big red candle is pushing the price little up...
An ascending triangle is formed....which is also a sign of bullishness from the previous resistance level...
without knowing we cannot take entry on buy side...
will wait for trendline break and retest....to go long from resistance acts as support.
Note
that big red candle rejecting the price to go down....**If these ideas are Helpful !
Please Like, Follow and Comment
Also share your thoughts in the comments section.
Thanks for your Support **
--Educational Purpose Only--
--Not SEBI Registered--
" i am a IT-Trader "
Please Like, Follow and Comment
Also share your thoughts in the comments section.
Thanks for your Support **
--Educational Purpose Only--
--Not SEBI Registered--
" i am a IT-Trader "
Related publications
Disclaimer
The information and publications are not meant to be, and do not constitute, financial, investment, trading, or other types of advice or recommendations supplied or endorsed by TradingView. Read more in the Terms of Use.
**If these ideas are Helpful !
Please Like, Follow and Comment
Also share your thoughts in the comments section.
Thanks for your Support **
--Educational Purpose Only--
--Not SEBI Registered--
" i am a IT-Trader "
Please Like, Follow and Comment
Also share your thoughts in the comments section.
Thanks for your Support **
--Educational Purpose Only--
--Not SEBI Registered--
" i am a IT-Trader "
Related publications
Disclaimer
The information and publications are not meant to be, and do not constitute, financial, investment, trading, or other types of advice or recommendations supplied or endorsed by TradingView. Read more in the Terms of Use.