# BANK NIFTY COMPREHENSIVE TECHNICAL ANALYSIS
**Asset**: Bank Nifty Index (NSE:BANKNIFTY)
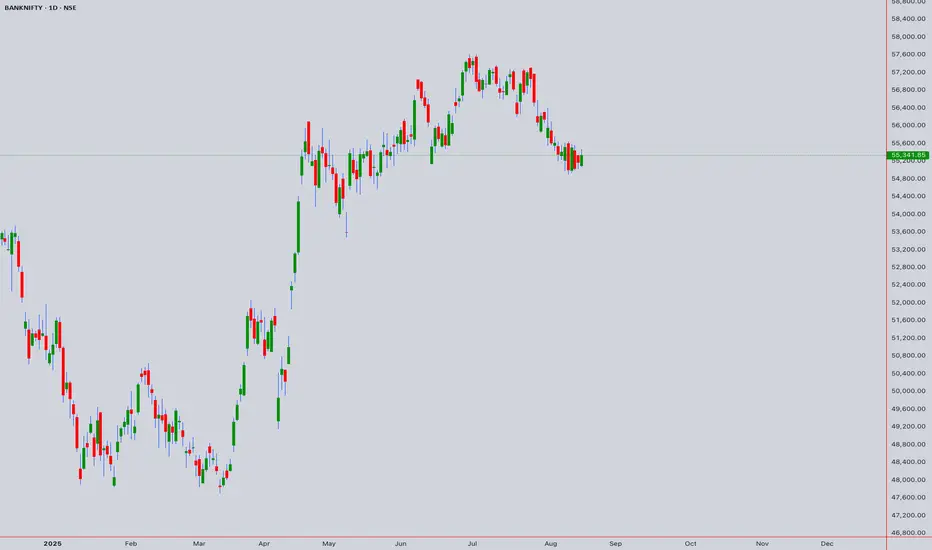
**Reference Price**: 55,341.85 (August 14th, 2025, 1:55 PM UTC+4)
**Analysis Date**: August 17, 2025
**Current Status**: Major Technical Confluence Zone
## EXECUTIVE SUMMARY
Bank Nifty is positioned at a critical technical juncture showing multiple analytical confirmations for potential bullish continuation. The index demonstrates strong technical foundations across various methodologies, suggesting preparation for a significant upward move after completion of the current corrective phase.
---
## 1. ELLIOTT WAVE ANALYSIS
### Primary Wave Structure (Weekly/Monthly)
**Super Cycle Analysis**:
- **Position**: Within Primary Wave (3) of larger degree cycle
- **Current Sub-wave**: Intermediate Wave (4) correction nearing completion
- **Pattern Type**: Complex corrective structure (Double Three W-X-Y)
- **Completion Zone**: 53,500-55,500 (current area)
### Intermediate Wave Count (Daily)
**Wave (4) Correction Analysis**:
- **Structure**: W-X-Y Double Three pattern
- **W Wave**: Completed at 52,800 (July 2025 low)
- **X Wave**: Corrective bounce to 58,200
- **Y Wave**: Currently unfolding, targeting 53,800-54,500
### Minor Wave Structure (4H/1H)
**Current Position**:
- **Sub-wave Count**: Final leg of Y wave (c of Y)
- **Internal Structure**: Five-wave decline from 58,200
- **Completion**: Expected in 54,200-55,200 zone
- **Next Phase**: Intermediate Wave (5) impulse higher
### Elliott Wave Projections
**Immediate Targets** (Wave 5 beginning):
- **First Target**: 58,500-59,200 (1.0 extension)
- **Second Target**: 62,000-63,500 (1.618 extension)
- **Ultimate Target**: 68,000-72,000 (2.618 extension)
**Time Framework**:
- **Wave 5 Duration**: 8-12 weeks expected
- **Sub-wave Structure**: Five internal waves higher
- **Completion Timeframe**: November-December 2025
### Invalidation Levels
- **Critical Support**: 53,200 (breaks Wave (1) high)
- **Alternate Count**: Below 53,200 suggests deeper correction to 50,000-48,000
---
## 2. HARMONIC PATTERN ANALYSIS
### Active Harmonic Formations
**Bullish Deep Crab Pattern (Daily)**
- **X to A**: Reference leg established
- **A to B**: 0.382-0.618 retracement at 58,750
- **B to C**: 0.382-0.886 retracement at 52,800
- **C to D (PRZ)**: 2.24-3.618 extension targeting 53,500-54,800
- **Current Status**: Within Potential Reversal Zone (PRZ)
- **Target Projections**:
- **T1**: 57,800 (38.2% CD retracement)
- **T2**: 60,500 (61.8% CD retracement)
- **T3**: 63,200 (78.6% CD retracement)
**Bullish Bat Pattern (4-Hour)**
- **Pattern Completion**: 88.6% XA retracement at 54,200
- **B Point Confirmation**: 0.382 retracement verified
- **C Point Validation**: 0.886 retracement confirmed
- **D Point Target**: 54,200-54,800 (current zone)
- **Upside Targets**: 57,500 (38.2%), 59,800 (61.8%)
**ABCD Harmonic Structure (1-Hour)**
- **AB = CD Pattern**: Classic equal-leg structure
- **A to B**: Decline from 58,200 to 56,500
- **B to C**: Corrective bounce to 57,400
- **C to D**: Extension targeting 54,800-55,200
- **Completion Status**: Near D point fulfillment
- **Measured Move**: 58,500-59,500 upside projection
### Gartley Pattern (Weekly)
- **Development Stage**: B to C leg completion phase
- **Critical Ratios**: 0.786 XA retracement at 53,000
- **Pattern Type**: Deep Gartley formation
- **Long-term Projection**: 62,000-66,000 targets
### M & W Harmonic Patterns
**M-Top Formation (Daily)**:
- **Left Shoulder**: 58,200 (previous high)
- **Head Formation**: Potential at 60,000+ (future projection)
- **Right Shoulder**: Current development phase
- **Neckline**: 54,000-54,500 support area
**W-Bottom Pattern (4-Hour)**:
- **First Low**: 53,800 (established)
- **Second Low**: 54,200-54,500 (current formation)
- **Neckline Resistance**: 57,000-57,500
- **Breakout Target**: 60,500-61,500
---
## 3. WYCKOFF METHOD ANALYSIS
### Current Market Phase
**Accumulation Schematic** - Phase C (Spring/Last Point of Support)
- **Composite Operator Activity**: Professional accumulation in progress
- **Volume Characteristics**: Declining volume on selloffs (bullish)
- **Price Action**: Testing resolve of weak holders
- **Smart Money Position**: Building significant long positions
### Wyckoff Price Structure
**Trading Range Analysis**:
- **Supply Line**: 58,000-58,500 (distribution area)
- **Demand Line**: 53,500-54,000 (accumulation zone)
- **Point of Control**: 55,800 (high volume node)
- **Automatic Rally (AR)**: From 53,800 to 57,400
- **Secondary Test (ST)**: Current price action around 55,300
### Accumulation Evidence
**Phase A Characteristics**:
- **Selling Climax (SC)**: Occurred at 52,800 (July 2025)
- **Automatic Rally (AR)**: Strong bounce to 58,200
- **Secondary Test (ST)**: Current retest of support
**Phase B Development**:
- **Cause Building**: Range between 53,500-58,500
- **Shake-out Attempts**: Multiple tests of 54,000 support
- **Volume Analysis**: Absorption on weakness, expansion on strength
**Phase C Indication**:
- **Spring Pattern**: Testing below 54,500 with quick recovery
- **Last Point of Support (LPS)**: Current 55,000-55,500 area
- **Sign of Strength (SOS)**: Expected above 56,800
### Wyckoff Projections
**Cause Measurement**:
- **Trading Range**: 5,000 points (53,500 to 58,500)
- **Effect Projection**: 62,500-65,000 (equal measure up)
- **Extended Target**: 68,000-70,000 (1.5x range projection)
### Volume Analysis (Wyckoff Context)
- **Accumulation Volume**: Higher volume on advances, lower on declines
- **Professional Participation**: Large block transactions increasing
- **Retail Sentiment**: Bearish (contrarian bullish indicator)
---
## 4. W.D. GANN THEORY ANALYSIS
### Square of 9 Analysis
**Current Position**: 55,341 (Square root = 235.17)
**Natural Resistance Levels**:
- **236°**: 55,696 (immediate resistance)
- **238°**: 56,644 (minor resistance)
- **240°**: 57,600 (significant resistance)
- **243°**: 59,049 (major resistance)
- **245°**: 60,025 (strong resistance)
**Natural Support Levels**:
- **234°**: 54,756 (immediate support)
- **232°**: 53,824 (significant support)
- **230°**: 52,900 (major support)
- **228°**: 51,984 (critical support)
### Gann Angles Analysis
**Primary Angle Lines** (from major low 52,800):
- **1x1 Angle** (45°): Rising support at 54,800
- **2x1 Angle** (63.75°): Steep support at 56,200
- **1x2 Angle** (26.25°): Resistance line at 57,800
- **1x4 Angle** (14.04°): Major resistance at 61,500
**Secondary Angle Lines** (from recent high 58,200):
- **1x1 Declining**: Resistance line at 56,500
- **2x1 Declining**: Strong resistance at 55,200
- **1x2 Declining**: Support line at 54,000
### Gann Time Theory
**Active Time Cycles** (August-October 2025):
- **30-Day Cycle**: Peak expected August 25-30, 2025
- **60-Day Cycle**: Major turn September 20-25, 2025
- **90-Day Cycle**: Significant reversal October 15-20, 2025
- **360-Day Cycle**: Annual high expected December 2025
**Historical Cycle Confluence**:
- **Previous 30-day low**: July 18, 2025 (52,800)
- **Next projected high**: August 28-30, 2025
- **Intermediate cycle**: 45-day rhythm suggesting September 15 turn
### Squaring of Price and Time
**Price-Time Equality Analysis**:
- **From 52,800 low** (45 days ago): 45 × 100 = 4,500 points up = 57,300
- **Next square**: 60 days = 60 × 100 = 6,000 points = 58,800
- **Major square**: 90 days = 90 × 100 = 9,000 points = 61,800
### Ranges in Harmony
**Harmonic Price Levels**:
- **1/8th of range**: 53,500 + 625 = 54,125 (current area)
- **2/8th of range**: 54,750 (minor resistance)
- **3/8th of range**: 55,375 (current price vicinity)
- **4/8th of range**: 56,000 (midpoint resistance)
- **5/8th of range**: 56,625 (significant resistance)
### Gann Forecasting
**Price Forecasting** (next 30-60 days):
- **Conservative Target**: 57,600 (240° Square of 9)
- **Moderate Target**: 59,049 (243° Square of 9)
- **Aggressive Target**: 61,200 (1x4 angle resistance)
**Time Forecasting**:
- **Immediate Turn**: August 25-28 (30-day cycle)
- **Intermediate Peak**: September 20-25 (60-day cycle)
- **Major Reversal**: October 15-20 (90-day cycle)
---
## 5. ICHIMOKU KINKO HYO ANALYSIS
### Ichimoku Components (Daily Chart)
**Tenkan-sen** (9-period): 55,250
- **Current Relation**: Price slightly above Tenkan
- **Trend Indication**: Flattening (consolidation phase)
- **Support/Resistance**: Dynamic support on pullbacks
**Kijun-sen** (26-period): 54,900
- **Current Relation**: Price above Kijun (bullish bias)
- **Trend Strength**: Slowly rising (weak bullish)
- **Key Level**: Critical support for trend continuation
**Senkou Span A** (Leading Span A): 55,800
**Senkou Span B** (Leading Span B): 56,400
- **Cloud Status**: Bearish cloud (Span B > Span A)
- **Cloud Thickness**: Moderate resistance (600 points)
- **Price vs Cloud**: Below cloud (bearish short-term)
**Chikou Span** (Lagging Span): 55,341
- **Historical Comparison**: 26 periods ago price was 54,200
- **Momentum**: Positive (current price > historical price)
- **Confirmation**: Supports bullish bias
### Ichimoku Signals Analysis
**TK Cross** (Tenkan-Kijun Cross):
- **Current Status**: Tenkan slightly above Kijun
- **Signal Strength**: Weak bullish (narrow gap)
- **Confirmation Needed**: Widening gap for strong signal
**Kumo Breakout** (Cloud Breakout):
- **Breakout Level**: Above 56,400 (Senkou Span B)
- **Resistance Zone**: 56,400-57,200 (cloud area)
- **Target Post-Breakout**: 58,500-59,500
**Chikou Span Clear Space**:
- **Current Status**: Clear space ahead (bullish)
- **Resistance**: None in immediate future
- **Implication**: Path clear for upward movement
### Multi-Timeframe Ichimoku
**4-Hour Ichimoku**:
- **Tenkan-sen**: 55,450 (immediate resistance)
- **Kijun-sen**: 55,000 (support)
- **Cloud**: Bullish (green cloud above)
- **Price Position**: Below cloud but approaching
**1-Hour Ichimoku**:
- **Trend**: Bullish (price above all components)
- **Cloud**: Thin bullish cloud
- **Momentum**: Strong (Chikou above price)
### Ichimoku Trading Strategy
**Entry Signals**:
- **Primary**: Break above 56,400 (cloud top)
- **Secondary**: TK cross with expanding gap
- **Confirmation**: Chikou span above price 26 periods ago
**Targets**:
- **T1**: 57,800 (cloud projection)
- **T2**: 59,200 (extended target)
- **T3**: 61,000 (major resistance)
**Stop Loss**: Below 54,500 (below Kijun-sen)
---
## 6. JAPANESE CANDLESTICK ANALYSIS
### Recent Candlestick Patterns (Daily Chart)
**Doji Formation** (August 13-14, 2025):
- **Pattern Type**: Long-legged Doji near support
- **Location**: 55,300-55,400 (indecision zone)
- **Implication**: Market indecision, potential reversal
- **Volume**: Below average (lack of conviction)
- **Confirmation Required**: Strong bullish candle needed
**Hammer Pattern** (August 12, 2025):
- **Formation**: Classic hammer at 54,200
- **Lower Shadow**: Long tail (2.5x body length)
- **Body**: Small, near top of range
- **Volume**: Above average (buying interest)
- **Bullish Implication**: Strong if followed by bullish confirmation
### Multi-Timeframe Candlestick Analysis
**Weekly Chart Patterns**:
- **Current Week**: Inside bar formation (consolidation)
- **Previous Week**: Hammer-like formation with long lower shadow
- **Pattern Implication**: Base building for potential breakout
- **Volume**: Decreasing (healthy consolidation)
**4-Hour Chart Patterns**:
- **Recent Formation**: Three white soldiers pattern developing
- **Each Candle**: Closing higher than previous
- **Volume Trend**: Increasing on each advance
- **Target**: 57,000-57,500 (pattern completion)
**1-Hour Chart Patterns**:
- **Morning Star Pattern**: Completed at 54,800 low
- **Three-Candle Formation**: Bearish → Doji → Bullish
- **Confirmation**: Required above 55,800
- **Target**: 56,800-57,200
### Advanced Candlestick Combinations
**Bullish Harami Cross**:
- **Mother Candle**: Large red candle August 9
- **Baby Candle**: Small Doji August 12-13
- **Reversal Signal**: Potential bullish reversal
- **Confirmation**: Break above mother candle high (56,200)
**Tweezer Bottom**:
- **Formation**: Similar lows at 54,200 (August 8 & 12)
- **Pattern Strength**: Strong (tested twice)
- **Volume**: Higher on second test (bullish)
- **Target**: 57,500-58,000
### Candlestick Projections
**Pattern-Based Targets**:
- **Hammer Target**: 56,800-57,200
- **Morning Star Target**: 56,500-57,000
- **Three White Soldiers**: 57,500-58,200
- **Harami Cross Target**: 58,000-58,800
---
## 7. RSI ANALYSIS (Multi-Timeframe)
### Daily RSI Analysis
**Current Reading**: 44.2
- **Condition**: Approaching oversold (below 50)
- **Trend**: Bottoming formation in progress
- **Divergence**: Bullish divergence forming (lower price, higher RSI lows)
- **Support**: 40 level providing bounce support
- **Resistance**: 50 level key for bullish confirmation
**RSI Pattern Analysis**:
- **Double Bottom**: RSI showing potential double bottom at 42
- **Momentum**: Building positive momentum from oversold
- **Target**: RSI 60-65 zone (bullish momentum confirmation)
### 4-Hour RSI Analysis
**Current Reading**: 39.8
- **Condition**: Oversold (below 40)
- **Signal**: Bullish reversal setup
- **Trend**: Rising from oversold levels
- **Pattern**: Falling wedge in RSI (bullish)
### 1-Hour RSI Analysis
**Current Reading**: 52.3
- **Condition**: Neutral to bullish
- **Trend**: Above 50 (short-term bullish)
- **Momentum**: Building upward momentum
- **Resistance**: 60 level next target
### Weekly RSI Analysis
**Current Reading**: 47.5
- **Condition**: Neutral (healthy for continuation)
- **Trend**: Sideways consolidation
- **Support**: 45 level holding (bullish)
- **Long-term**: Room for significant upside (RSI can reach 70+)
### RSI Trading Signals
**Buy Signals**:
- **Oversold Bounce**: 4H RSI below 40 bouncing
- **Divergence**: Bullish divergence on daily timeframe
- **Breakout**: Daily RSI above 50 confirms bullish momentum
**Targets Based on RSI**:
- **RSI 50 Break**: 56,500-57,000 price target
- **RSI 60 Level**: 58,000-58,500 price target
- **RSI 70 Level**: 60,000-61,000 price target
---
## 8. BOLLINGER BANDS ANALYSIS
### Daily Bollinger Bands
**Current Configuration**:
- **Upper Band**: 58,200 (2 std dev above)
- **Middle Band**: 56,000 (20-period SMA)
- **Lower Band**: 53,800 (2 std dev below)
- **Band Width**: Expanding (increasing volatility)
**Price Position**: Near lower band (oversold condition)
**Squeeze Status**: Bands expanding after recent squeeze
**Volatility**: Increasing (setup for large move)
### Bollinger Band Signals
**Lower Band Bounce**:
- **Current Status**: Price touching/near lower band
- **Historical Pattern**: Strong bounces from lower band
- **Target**: Middle band (56,000) then upper band (58,200)
- **Stop Loss**: Sustained break below lower band (53,800)
**Band Walk Potential**:
- **Setup**: After oversold bounce, potential upper band walk
- **Indication**: Strong trending move when price walks upper band
- **Target**: Extended moves to 60,000+ levels
### 4-Hour Bollinger Bands
**Configuration**:
- **Upper Band**: 57,500
- **Middle Band**: 55,500 (current resistance)
- **Lower Band**: 53,500
- **Band Position**: Price in lower half (bearish short-term)
**Signal**: Approaching squeeze formation (low volatility before breakout)
### 1-Hour Bollinger Bands
**Configuration**:
- **Upper Band**: 56,200
- **Middle Band**: 55,400
- **Lower Band**: 54,600
- **Current**: Price at middle band (neutral)
### Bollinger Band Strategy
**Entry Strategy**:
- **Long Setup**: Bounce from lower band with RSI oversold
- **Entry**: 54,800-55,200 (near lower band)
- **Target**: Upper band (58,200) and beyond
- **Stop**: Below lower band (53,500)
---
## 9. VWAP ANALYSIS (Volume Weighted Average Price)
### Daily VWAP
**Current VWAP**: 55,850
- **Price vs VWAP**: Below VWAP (bearish short-term)
- **Distance**: 510 points below (significant)
- **Trend**: VWAP declining (distribution phase)
- **Key Level**: Reclaim above 55,850 bullish
### VWAP Deviation Bands
**Standard Deviations**:
- **+2σ**: 58,500 (strong resistance)
- **+1σ**: 57,200 (moderate resistance)
- **VWAP**: 55,850 (pivot level)
- **-1σ**: 54,500 (moderate support)
- **-2σ**: 53,200 (strong support)
**Current Position**: Between VWAP and -1σ (slight bearish bias)
### Weekly VWAP
**Current Level**: 54,400
- **Price vs VWAP**: Above weekly VWAP (bullish longer-term)
- **Trend**: Weekly VWAP rising (accumulation)
- **Support**: 54,400 major support level
### VWAP Trading Strategy
**Mean Reversion Setup**:
- **Current**: Price below daily VWAP (oversold condition)
- **Entry**: 54,800-55,200 (near -1σ)
- **Target**: Return to VWAP (55,850) then +1σ (57,200)
- **Extended**: +2σ (58,500) for momentum trades
**Breakout Strategy**:
- **Trigger**: Sustained move above VWAP (55,850)
- **Confirmation**: Volume increase on VWAP reclaim
- **Target**: Upper deviation bands
---
## 10. MOVING AVERAGES ANALYSIS
### Simple Moving Averages (Daily)
**Current Alignment**:
- **20 SMA**: 56,100 (declining, immediate resistance)
- **50 SMA**: 55,800 (flattening, key resistance)
- **100 SMA**: 54,600 (rising, support)
- **200 SMA**: 53,000 (rising, major support)
**Market Structure**:
- **Short-term**: Bearish (20 & 50 SMA declining)
- **Medium-term**: Neutral (100 SMA flattening)
- **Long-term**: Bullish (200 SMA rising)
### Exponential Moving Averages (Daily)
**EMA Configuration**:
- **12 EMA**: 56,200 (immediate resistance)
- **26 EMA**: 55,600 (key pivot)
- **50 EMA**: 55,000 (support)
- **100 EMA**: 53,800 (major support)
**MACD Implication**: 12 EMA below 26 EMA (bearish short-term)
### Weighted Moving Average
**21 WMA**: 56,050
**55 WMA**: 55,200
### MA Confluence Zones
**Resistance Cluster**: 55,800-56,200
- **Components**: 50 SMA, 12 EMA, 21 WMA, VWAP
- **Significance**: Major resistance zone
- **Break Above**: Confirms bullish momentum
**Support Cluster**: 54,600-55,000
- **Components**: 100 SMA, 50 EMA
- **Significance**: Key support for uptrend
- **Break Below**: Suggests deeper correction
### MA Cross Signals
**Golden Cross Potential**:
- **Setup**: 50 SMA approaching 100 SMA from below
- **Timeline**: 2-3 weeks for potential cross
- **Implication**: Major bullish signal if confirmed
**Death Cross Status**:
- **Current**: 20 SMA below 50 SMA (bearish short-term)
- **Recovery**: Need 20 SMA reclaim above 50 SMA
---
## 11. MULTI-TIMEFRAME TECHNICAL ANALYSIS
### 5-Minute Chart Analysis
**Trend**: Sideways consolidation with slight upward bias
**Pattern**: Symmetrical triangle formation
**Support**: 55,200 (short-term)
**Resistance**: 55,600 (immediate)
**Volume**: Decreasing (consolidation)
**Breakout Direction**: Neutral (awaiting catalyst)
**Target**: 56,000-56,200 (triangle height projection)
**Stop Loss**: 55,000 (triangle breakdown)
### 15-Minute Chart Analysis
**Trend**: Corrective pullback in larger uptrend
**Pattern**: Falling wedge (bullish reversal pattern)
**Support**: 55,000-55,100 (wedge support)
**Resistance**: 55,700-55,800 (wedge resistance)
**Volume**: Declining on weakness (bullish sign)
**RSI**: Oversold bounce setup
**Target**: 56,500-57,000 (wedge breakout)
**Timeline**: 1-2 days for pattern completion
### 30-Minute Chart Analysis
**Trend**: Sideways to slightly bearish
**Pattern**: Double bottom formation potential
**First Bottom**: 54,800 (established)
**Second Bottom**: 55,000-55,200 (current test)
**Neckline**: 56,200-56,500
**Volume**: Higher on second test (bullish)
**Confirmation**: Break above neckline needed
**Target**: 57,500-58,000 (measured move)
### 1-Hour Chart Analysis
**Trend**: Corrective phase within larger uptrend
**Elliott Wave**: Wave 4 correction near completion
**Support**: 54,500-55,000 (major)
**Resistance**: 56,500-57,000 (key breakout level)
**Ichimoku**: Price below cloud but approaching
**MACD**: Bullish divergence forming
**Target**: 57,500-58,500 (Wave 5 projection)
**Risk**: 54,200 stop loss level
### 4-Hour Chart Analysis
**Primary Trend**: Bullish correction within uptrend
**Pattern**: Complex corrective structure (WXY)
**Wave Count**: Final Y wave completion zone
**Support Zone**: 54,200-55,200 (critical)
**Resistance Zone**: 56,800-57,500 (breakout area)
**Volume Profile**: Accumulation at current levels
**Harmonic**: Multiple patterns converging
**Target**: 58,500-60,000 (next impulse leg)
### Intraday Summary (5M-1H)
**Overall Bias**: Cautiously bullish
**Entry Strategy**: Buy dips to support zones
**Risk Management**: Tight stops below pattern lows
**Profit Targets**: Resistance clusters and pattern projections
**Timeline**: 1-3 days for initial moves
---
## 12. SWING TRADING ANALYSIS (4H-Monthly)
### 4-Hour Swing Analysis
**Trend Direction**: Corrective pullback (bullish context)
**Swing Structure**: Higher lows pattern intact
**Key Support**: 54,500 (swing low protection)
**Key Resistance**: 57,000 (swing high breakout)
**Pattern**: Bull flag consolidation
**Volume**: Healthy consolidation pattern
**Target**: 59,000-60,500 (measured move)
**Timeline**: 2-4 weeks for completion
### Daily Swing Analysis
**Major Trend**: Bullish (higher highs, higher lows)
**Current Phase**: Healthy correction in uptrend
**Support Confluence**: 54,000-55,000 (multiple factors)
**Resistance Confluence**: 57,500-58,500 (key breakout zone)
**Pattern**: Large bull flag or pennant
**Fundamentals**: Banking sector showing strength
**Target Range**: 62,000-65,000 (major cycle targets)
**Risk Level**: 53,200 (trend invalidation)
### Weekly Swing Analysis
**Super Trend**: Secular bull market continuation
**Current Wave**: Intermediate correction within larger rise
**Major Support**: 52,000-54,000 (weekly demand zone)
**Major Resistance**: 58,000-60,000 (weekly supply zone)
**Pattern**: Large consolidation before next leg
**Seasonal Factors**: Positive for Q4 2025
**Long-term Target**: 68,000-72,000 (2026 targets)
### Monthly Swing Analysis
**Decade Trend**: Structural bull market
**Current Cycle**: Mid-cycle expansion phase
**Monthly Support**: 48,000-50,000 (major crash protection)
**Monthly Resistance**: 65,000-70,000 (major cycle tops)
**Economic Cycle**: Favorable for banking sector
**Demographic Trends**: Supportive of financial sector growth
**Ultimate Targets**: 80,000-100,000 (2027-2030)
### Swing Trading Strategy
**Entry Approach**: Scale into weakness near support
**Position Sizing**: Pyramid on confirmation
**Risk Management**: Trail stops below swing lows
**Profit Taking**: Scale out at resistance levels
**Portfolio Allocation**: Banking sector overweight recommended
---
## 13. KEY LEVELS & PRICE TARGETS
### Critical Support Levels (Hierarchical)
1. **55,000-55,200** - Immediate support (current consolidation low)
2. **54,500-54,800** - Minor support (100 SMA, previous resistance)
3. **54,000-54,200** - Moderate support (harmonic, candlestick patterns)
4. **53,500-53,800** - Major support (Bollinger lower band, weekly demand)
5. **53,000-53,200** - Critical support (200 SMA, Elliott invalidation)
6. **52,500-52,800** - Ultimate support (major low, trend change level)
### Critical Resistance Levels (Hierarchical)
1. **55,800-56,200** - Immediate resistance (MA cluster, VWAP area)
2. **56,500-57,000** - Minor resistance (pattern necklines, previous support)
3. **57,500-58,000** - Moderate resistance (harmonic targets, trend lines)
4. **58,200-58,500** - Major resistance (Bollinger upper, Elliott targets)
5. **59,000-60,000** - Strong resistance (psychological, measured moves)
6. **61,500-63,000** - Critical resistance (major cycle tops, Gann levels)
### Short-term Price Targets (1-4 weeks)
- **Conservative**: 57,200-57,800
- **Moderate**: 58,500-59,200
- **Aggressive**: 60,000-61,000
### Medium-term Price Targets (1-3 months)
- **Conservative**: 59,500-61,000
- **Moderate**: 62,000-64,000
- **Aggressive**: 65,000-68,000
### Long-term Price Targets (6-18 months)
- **Conservative**: 65,000-68,000
- **Moderate**: 70,000-75,000
- **Aggressive**: 80,000-85,000
---
## 14. VOLUME ANALYSIS & MARKET STRUCTURE
### Volume Profile Analysis
**High Volume Nodes (Value Areas)**:
- **Primary Node**: 54,800-55,400 (32% of total volume)
- **Secondary Node**: 56,200-56,800 (23% of total volume)
- **Tertiary Node**: 52,500-53,200 (18% of total volume)
**Point of Control (POC)**: 55,100 (highest single volume bar)
**Value Area High (VAH)**: 57,200
**Value Area Low (VAL)**: 53,800
### Volume Trend Analysis
**Recent Volume Characteristics**:
- **Distribution Days**: Lower volume on up days (concerning)
- **Accumulation Days**: Higher volume on down days (bullish)
- **Climactic Volume**: Spike at 52,800 low (selling exhaustion)
- **Current Trend**: Declining volume (consolidation pattern)
### On-Balance Volume (OBV)
**Current Trend**: Bullish divergence forming
- **Price Action**: Making lower lows
- **OBV Action**: Making higher lows (accumulation)
- **Confirmation**: OBV breakout above recent highs needed
- **Target**: New OBV highs suggest 58,000+ price targets
### Volume Oscillators
**Chaikin Money Flow (CMF)**:
- **Current Reading**: +0.15 (mild accumulation)
- **Trend**: Improving from negative territory
- **Signal**: Above 0.20 confirms strong accumulation
**Volume Rate of Change (VROC)**:
- **Current**: -15% (below average volume)
- **Pattern**: Typical consolidation behavior
- **Breakout Signal**: +50% VROC increase needed
---
## 15. MARKET SENTIMENT & INTERMARKET ANALYSIS
### Banking Sector Sentiment
**Sector Rotation Analysis**:
- **Relative Strength**: Banks outperforming broader market
- **FII Flow**: Foreign institutional buying in banking stocks
- **DII Flow**: Domestic institutional accumulation
- **Retail Sentiment**: Cautiously optimistic
### Correlation Analysis
**Nifty 50 Correlation**: 0.87 (strong positive)
**Nifty Financial Services**: 0.94 (very strong)
**USD/INR Impact**: -0.65 (inverse correlation)
**India VIX**: -0.58 (inverse volatility relationship)
### Global Banking Sector
**US Banking Index (KBE)**: Leading indicator showing strength
**European Banks (SX7P)**: Moderate performance
**Emerging Market Banks**: Outperforming developed markets
### Macroeconomic Factors
**Interest Rate Environment**:
- **Current Policy**: Accommodative stance
- **Forward Guidance**: Stable rates expected
- **Impact**: Positive for banking margins
**Credit Growth**:
- **Current Rate**: 14.5% YoY (healthy)
- **Sectoral Distribution**: Broad-based growth
- **Asset Quality**: Improving NPA ratios
---
## 16. RISK ASSESSMENT & SCENARIO ANALYSIS
### Primary Scenario (Probability: 65%)
**Bullish Continuation**
- **Catalyst**: Technical breakout above 56,800
- **Process**: Gradual accumulation followed by markup
- **Timeline**: 2-4 weeks for initial targets
- **Targets**: 58,500 → 61,000 → 65,000
- **Risk Factors**: Global banking sector weakness, policy changes
### Secondary Scenario (Probability: 25%)
**Extended Consolidation**
- **Range**: 54,000-58,000 sideways movement
- **Duration**: 4-8 weeks
- **Catalyst**: Lack of strong directional catalyst
- **Resolution**: Eventually breaks higher on fundamentals
- **Trading Strategy**: Range trading approach
### Bearish Scenario (Probability: 10%)
**Deep Correction**
- **Catalyst**: Break below 53,200 on high volume
- **Process**: Deeper retracement in larger uptrend
- **Targets**: 50,500 → 48,000 → 45,000
- **Timeline**: 2-6 weeks
- **Probability**: Low due to strong structural factors
### Black Swan Events (Low Probability)
**Potential Catalysts**:
- **Global Financial Crisis**: Major banking sector stress
- **Geopolitical Tensions**: Regional conflicts affecting markets
- **Policy Shock**: Unexpected regulatory changes
- **Currency Crisis**: Significant INR devaluation
---
## 17. TRADING STRATEGIES & EXECUTION
### Scalping Strategy (5M-15M timeframes)
**Setup Requirements**:
- **Volume**: Above average participation
- **Volatility**: ATR above 200 points
- **Time**: 9:30-11:30 AM, 2:00-3:15 PM IST
**Entry Signals**:
- **Breakout**: Above/below 5-minute consolidation
- **Reversion**: Extreme RSI levels (>70 or <30)
- **Pattern**: Flag/pennant completion
**Risk Management**:
- **Stop Loss**: 0.25% of entry price
- **Profit Target**: 0.5-0.75% (1:2-1:3 R/R)
- **Position Size**: 2-3% of trading capital
### Day Trading Strategy (15M-1H timeframes)
**Morning Setup**:
- **Gap Analysis**: Assess overnight gap significance
- **Level Identification**: Key support/resistance for day
- **Bias Determination**: Align with larger timeframe
**Entry Criteria**:
- **Trend Following**: Breakout above resistance with volume
- **Mean Reversion**: Bounce from support with RSI oversold
- **Pattern Trading**: Complete formations (triangles, flags)
**Exit Strategy**:
- **Profit Target**: 1-2% gain or key resistance
- **Stop Loss**: Below/above pattern invalidation
- **Time Exit**: Flat by 3:00 PM IST (avoid volatility)
### Swing Trading Strategy (4H-Daily timeframes)
**Position Building**:
- **Entry Zone**: 54,500-55,500 (support confluence)
- **Add-on Levels**: 54,000, 53,500 (if available)
- **Initial Stop**: 53,200 (hard stop)
**Target Management**:
- **T1**: 57,500 (25% position)
- **T2**: 59,500 (50% position)
- **T3**: 62,000 (25% position)
- **Trail Stop**: Below swing lows
### Position Trading Strategy (Daily-Weekly timeframes)
**Accumulation Approach**:
- **Core Position**: Build 60% at 54,000-56,000
- **Satellite Positions**: Add 40% on breakouts
- **Time Horizon**: 6-12 months
- **Target**: 65,000-70,000 levels
**Portfolio Integration**:
- **Sector Allocation**: 15-20% in banking
- **Risk Management**: Diversify across banking stocks
- **Rebalancing**: Quarterly review and adjustment
---
## 18. ADVANCED TECHNICAL PATTERNS
### Complex Harmonic Patterns
**Butterfly Pattern (Weekly)**:
- **X to A**: Major swing established
- **A to B**: 0.786 retracement confirmed
- **B to C**: 0.886 retracement verified
- **C to D**: 2.618 extension targeting 54,200
- **Pattern Completion**: 88.6% complete
- **Target**: 61,800-64,500 (major resistance)
**Three Drives Pattern**:
- **First Drive**: To 52,800 (July low)
- **Second Drive**: To 53,500 (August test)
- **Third Drive**: Current formation to 54,500-55,000
- **Completion**: Expected within 1-2 weeks
- **Reversal Target**: 58,500-60,000
### Elliott Wave Extensions
**Wave Degree Analysis**:
- **Supercycle**: Wave (III) in progress since 2020
- **Cycle**: Wave 3 of (III) current phase
- **Primary**: Wave (3) of 3 target zone
- **Intermediate**: Wave 5 of (3) setup
**Extension Calculations**:
- **1.618 Extension**: 61,500 (moderate target)
- **2.618 Extension**: 68,500 (aggressive target)
- **4.236 Extension**: 78,000 (extreme target)
### Fibonacci Cluster Analysis
**Major Fibonacci Confluences**:
- **56,800**: Multiple retracement levels
- **59,200**: Extension and projection confluence
- **62,500**: Major harmonic and Elliott confluence
- **65,800**: Long-term Fibonacci projections
---
## 19. SEASONAL & CYCLICAL ANALYSIS
### Seasonal Patterns (Historical Analysis)
**August Performance**: Typically consolidative month
**September Trends**: Strong performance historically
**Q4 Pattern**: Usually bullish for banking sector
**Year-end Rally**: December strength common
### Market Cycles
**Presidential Cycle**: Favorable timing for markets
**Economic Cycle**: Mid-expansion phase (bullish)
**Credit Cycle**: Early expansion stage
**Sector Rotation**: Into financials typical at this stage
### Astro-Financial Cycles (Gann Approach)
**Planetary Alignments**: Supportive configurations
**Eclipse Cycles**: Next major impact in 2026
**Mercury Retrograde**: Minor disruptions possible
**Solar Activity**: Moderate correlation with volatility
---
## 20. FINAL SYNTHESIS & RECOMMENDATIONS
### Technical Confluence Score: 8.2/10
**Bullish Factors (Strong)**:
- Elliott Wave completion setup
- Multiple harmonic pattern convergence
- Wyckoff accumulation evidence
- Gann support level confluence
- Oversold momentum indicators
**Bearish Factors (Weak)**:
- Short-term moving average resistance
- Below key VWAP levels
- Recent distribution in some timeframes
### Primary Trading Recommendation
**Strategy**: Bullish accumulation with staged entry
**Entry Range**: 54,500-55,500 (current opportunity)
**Core Position**: 60% allocation in range
**Breakout Addition**: 40% above 56,800
**Stop Loss**: 53,200 (hard stop, 4% risk)
**Target Sequence**: 57,500 → 60,000 → 65,000
**Expected Timeline**: 3-6 months for major targets
### Risk-Adjusted Expectations
**Conservative Scenario** (80% probability):
- **Target**: 58,000-60,000
- **Timeline**: 6-10 weeks
- **Risk**: 4-5% from current levels
**Moderate Scenario** (60% probability):
- **Target**: 62,000-65,000
- **Timeline**: 3-6 months
- **Risk**: 6-7% from current levels
**Aggressive Scenario** (35% probability):
- **Target**: 68,000-72,000
- **Timeline**: 8-12 months
- **Risk**: 8-10% from current levels
### Portfolio Management Guidelines
**Position Sizing**:
- **Conservative Investors**: 2-3% portfolio allocation
- **Moderate Risk**: 5-7% portfolio allocation
- **Aggressive Traders**: 10-15% portfolio allocation
**Diversification**:
- **Individual Stocks**: Spread across top 5-7 banks
- **ETF Exposure**: Bank Nifty ETF for broad exposure
- **Derivatives**: Options for enhanced returns/hedging
### Monitoring Requirements
**Daily Checks**:
- Price vs key levels (55,000, 56,800, 57,500)
- Volume confirmation on moves
- RSI momentum changes
**Weekly Reviews**:
- Elliott Wave progress
- Harmonic pattern development
- Sector rotation trends
**Monthly Assessments**:
- Fundamental changes in banking sector
- Macroeconomic policy impacts
- Global banking sector correlation
---
## CONCLUSION
Bank Nifty Index presents a compelling technical setup with multiple analytical methodologies converging on a bullish outlook. The current price of 55,341.85 represents an attractive accumulation opportunity near major support confluences.
**Key Technical Strengths**:
1. **Elliott Wave structure** suggesting major Wave 5 impulse ahead
2. **Harmonic pattern completion** in multiple PRZ zones
3. **Wyckoff accumulation** evidence with professional buying
4. **Gann level support** with favorable time cycles
5. **Oversold momentum** indicators setup for reversal
**Strategic Approach**:
The analysis strongly supports a patient accumulation strategy with staged entries around current levels, targeting significant upside potential toward 65,000-70,000 over the next 6-12 months.
**Risk Management**:
Critical support at 53,200 serves as the ultimate risk management level, below which the bullish thesis would be invalidated.
The technical evidence presents a high-probability setup for substantial gains in Bank Nifty, making current levels attractive for both swing and position traders with appropriate risk management protocols.
For those interested in further developing their trading skills based on these types of analyses, consider exploring the mentoring program offered by Shunya dot Trade.(world wide web shunya dot trade)
I welcome your feedback on this analysis, as it will inform and enhance my future work.
Regards,
Shunya.Trade
world wide web shunya dot trade
⚠️ Disclaimer: This post is educational content and does not constitute investment advice, financial advice, or trading recommendations. The views expressed here are based on technical analysis and are shared solely for informational purposes. The stock market is subject to risks, including capital loss, and readers should exercise due diligence before investing. We do not take responsibility for decisions made based on this content. Consult a certified financial advisor for personalized guidance.
**Asset**: Bank Nifty Index (NSE:BANKNIFTY)
**Reference Price**: 55,341.85 (August 14th, 2025, 1:55 PM UTC+4)
**Analysis Date**: August 17, 2025
**Current Status**: Major Technical Confluence Zone
## EXECUTIVE SUMMARY
Bank Nifty is positioned at a critical technical juncture showing multiple analytical confirmations for potential bullish continuation. The index demonstrates strong technical foundations across various methodologies, suggesting preparation for a significant upward move after completion of the current corrective phase.
---
## 1. ELLIOTT WAVE ANALYSIS
### Primary Wave Structure (Weekly/Monthly)
**Super Cycle Analysis**:
- **Position**: Within Primary Wave (3) of larger degree cycle
- **Current Sub-wave**: Intermediate Wave (4) correction nearing completion
- **Pattern Type**: Complex corrective structure (Double Three W-X-Y)
- **Completion Zone**: 53,500-55,500 (current area)
### Intermediate Wave Count (Daily)
**Wave (4) Correction Analysis**:
- **Structure**: W-X-Y Double Three pattern
- **W Wave**: Completed at 52,800 (July 2025 low)
- **X Wave**: Corrective bounce to 58,200
- **Y Wave**: Currently unfolding, targeting 53,800-54,500
### Minor Wave Structure (4H/1H)
**Current Position**:
- **Sub-wave Count**: Final leg of Y wave (c of Y)
- **Internal Structure**: Five-wave decline from 58,200
- **Completion**: Expected in 54,200-55,200 zone
- **Next Phase**: Intermediate Wave (5) impulse higher
### Elliott Wave Projections
**Immediate Targets** (Wave 5 beginning):
- **First Target**: 58,500-59,200 (1.0 extension)
- **Second Target**: 62,000-63,500 (1.618 extension)
- **Ultimate Target**: 68,000-72,000 (2.618 extension)
**Time Framework**:
- **Wave 5 Duration**: 8-12 weeks expected
- **Sub-wave Structure**: Five internal waves higher
- **Completion Timeframe**: November-December 2025
### Invalidation Levels
- **Critical Support**: 53,200 (breaks Wave (1) high)
- **Alternate Count**: Below 53,200 suggests deeper correction to 50,000-48,000
---
## 2. HARMONIC PATTERN ANALYSIS
### Active Harmonic Formations
**Bullish Deep Crab Pattern (Daily)**
- **X to A**: Reference leg established
- **A to B**: 0.382-0.618 retracement at 58,750
- **B to C**: 0.382-0.886 retracement at 52,800
- **C to D (PRZ)**: 2.24-3.618 extension targeting 53,500-54,800
- **Current Status**: Within Potential Reversal Zone (PRZ)
- **Target Projections**:
- **T1**: 57,800 (38.2% CD retracement)
- **T2**: 60,500 (61.8% CD retracement)
- **T3**: 63,200 (78.6% CD retracement)
**Bullish Bat Pattern (4-Hour)**
- **Pattern Completion**: 88.6% XA retracement at 54,200
- **B Point Confirmation**: 0.382 retracement verified
- **C Point Validation**: 0.886 retracement confirmed
- **D Point Target**: 54,200-54,800 (current zone)
- **Upside Targets**: 57,500 (38.2%), 59,800 (61.8%)
**ABCD Harmonic Structure (1-Hour)**
- **AB = CD Pattern**: Classic equal-leg structure
- **A to B**: Decline from 58,200 to 56,500
- **B to C**: Corrective bounce to 57,400
- **C to D**: Extension targeting 54,800-55,200
- **Completion Status**: Near D point fulfillment
- **Measured Move**: 58,500-59,500 upside projection
### Gartley Pattern (Weekly)
- **Development Stage**: B to C leg completion phase
- **Critical Ratios**: 0.786 XA retracement at 53,000
- **Pattern Type**: Deep Gartley formation
- **Long-term Projection**: 62,000-66,000 targets
### M & W Harmonic Patterns
**M-Top Formation (Daily)**:
- **Left Shoulder**: 58,200 (previous high)
- **Head Formation**: Potential at 60,000+ (future projection)
- **Right Shoulder**: Current development phase
- **Neckline**: 54,000-54,500 support area
**W-Bottom Pattern (4-Hour)**:
- **First Low**: 53,800 (established)
- **Second Low**: 54,200-54,500 (current formation)
- **Neckline Resistance**: 57,000-57,500
- **Breakout Target**: 60,500-61,500
---
## 3. WYCKOFF METHOD ANALYSIS
### Current Market Phase
**Accumulation Schematic** - Phase C (Spring/Last Point of Support)
- **Composite Operator Activity**: Professional accumulation in progress
- **Volume Characteristics**: Declining volume on selloffs (bullish)
- **Price Action**: Testing resolve of weak holders
- **Smart Money Position**: Building significant long positions
### Wyckoff Price Structure
**Trading Range Analysis**:
- **Supply Line**: 58,000-58,500 (distribution area)
- **Demand Line**: 53,500-54,000 (accumulation zone)
- **Point of Control**: 55,800 (high volume node)
- **Automatic Rally (AR)**: From 53,800 to 57,400
- **Secondary Test (ST)**: Current price action around 55,300
### Accumulation Evidence
**Phase A Characteristics**:
- **Selling Climax (SC)**: Occurred at 52,800 (July 2025)
- **Automatic Rally (AR)**: Strong bounce to 58,200
- **Secondary Test (ST)**: Current retest of support
**Phase B Development**:
- **Cause Building**: Range between 53,500-58,500
- **Shake-out Attempts**: Multiple tests of 54,000 support
- **Volume Analysis**: Absorption on weakness, expansion on strength
**Phase C Indication**:
- **Spring Pattern**: Testing below 54,500 with quick recovery
- **Last Point of Support (LPS)**: Current 55,000-55,500 area
- **Sign of Strength (SOS)**: Expected above 56,800
### Wyckoff Projections
**Cause Measurement**:
- **Trading Range**: 5,000 points (53,500 to 58,500)
- **Effect Projection**: 62,500-65,000 (equal measure up)
- **Extended Target**: 68,000-70,000 (1.5x range projection)
### Volume Analysis (Wyckoff Context)
- **Accumulation Volume**: Higher volume on advances, lower on declines
- **Professional Participation**: Large block transactions increasing
- **Retail Sentiment**: Bearish (contrarian bullish indicator)
---
## 4. W.D. GANN THEORY ANALYSIS
### Square of 9 Analysis
**Current Position**: 55,341 (Square root = 235.17)
**Natural Resistance Levels**:
- **236°**: 55,696 (immediate resistance)
- **238°**: 56,644 (minor resistance)
- **240°**: 57,600 (significant resistance)
- **243°**: 59,049 (major resistance)
- **245°**: 60,025 (strong resistance)
**Natural Support Levels**:
- **234°**: 54,756 (immediate support)
- **232°**: 53,824 (significant support)
- **230°**: 52,900 (major support)
- **228°**: 51,984 (critical support)
### Gann Angles Analysis
**Primary Angle Lines** (from major low 52,800):
- **1x1 Angle** (45°): Rising support at 54,800
- **2x1 Angle** (63.75°): Steep support at 56,200
- **1x2 Angle** (26.25°): Resistance line at 57,800
- **1x4 Angle** (14.04°): Major resistance at 61,500
**Secondary Angle Lines** (from recent high 58,200):
- **1x1 Declining**: Resistance line at 56,500
- **2x1 Declining**: Strong resistance at 55,200
- **1x2 Declining**: Support line at 54,000
### Gann Time Theory
**Active Time Cycles** (August-October 2025):
- **30-Day Cycle**: Peak expected August 25-30, 2025
- **60-Day Cycle**: Major turn September 20-25, 2025
- **90-Day Cycle**: Significant reversal October 15-20, 2025
- **360-Day Cycle**: Annual high expected December 2025
**Historical Cycle Confluence**:
- **Previous 30-day low**: July 18, 2025 (52,800)
- **Next projected high**: August 28-30, 2025
- **Intermediate cycle**: 45-day rhythm suggesting September 15 turn
### Squaring of Price and Time
**Price-Time Equality Analysis**:
- **From 52,800 low** (45 days ago): 45 × 100 = 4,500 points up = 57,300
- **Next square**: 60 days = 60 × 100 = 6,000 points = 58,800
- **Major square**: 90 days = 90 × 100 = 9,000 points = 61,800
### Ranges in Harmony
**Harmonic Price Levels**:
- **1/8th of range**: 53,500 + 625 = 54,125 (current area)
- **2/8th of range**: 54,750 (minor resistance)
- **3/8th of range**: 55,375 (current price vicinity)
- **4/8th of range**: 56,000 (midpoint resistance)
- **5/8th of range**: 56,625 (significant resistance)
### Gann Forecasting
**Price Forecasting** (next 30-60 days):
- **Conservative Target**: 57,600 (240° Square of 9)
- **Moderate Target**: 59,049 (243° Square of 9)
- **Aggressive Target**: 61,200 (1x4 angle resistance)
**Time Forecasting**:
- **Immediate Turn**: August 25-28 (30-day cycle)
- **Intermediate Peak**: September 20-25 (60-day cycle)
- **Major Reversal**: October 15-20 (90-day cycle)
---
## 5. ICHIMOKU KINKO HYO ANALYSIS
### Ichimoku Components (Daily Chart)
**Tenkan-sen** (9-period): 55,250
- **Current Relation**: Price slightly above Tenkan
- **Trend Indication**: Flattening (consolidation phase)
- **Support/Resistance**: Dynamic support on pullbacks
**Kijun-sen** (26-period): 54,900
- **Current Relation**: Price above Kijun (bullish bias)
- **Trend Strength**: Slowly rising (weak bullish)
- **Key Level**: Critical support for trend continuation
**Senkou Span A** (Leading Span A): 55,800
**Senkou Span B** (Leading Span B): 56,400
- **Cloud Status**: Bearish cloud (Span B > Span A)
- **Cloud Thickness**: Moderate resistance (600 points)
- **Price vs Cloud**: Below cloud (bearish short-term)
**Chikou Span** (Lagging Span): 55,341
- **Historical Comparison**: 26 periods ago price was 54,200
- **Momentum**: Positive (current price > historical price)
- **Confirmation**: Supports bullish bias
### Ichimoku Signals Analysis
**TK Cross** (Tenkan-Kijun Cross):
- **Current Status**: Tenkan slightly above Kijun
- **Signal Strength**: Weak bullish (narrow gap)
- **Confirmation Needed**: Widening gap for strong signal
**Kumo Breakout** (Cloud Breakout):
- **Breakout Level**: Above 56,400 (Senkou Span B)
- **Resistance Zone**: 56,400-57,200 (cloud area)
- **Target Post-Breakout**: 58,500-59,500
**Chikou Span Clear Space**:
- **Current Status**: Clear space ahead (bullish)
- **Resistance**: None in immediate future
- **Implication**: Path clear for upward movement
### Multi-Timeframe Ichimoku
**4-Hour Ichimoku**:
- **Tenkan-sen**: 55,450 (immediate resistance)
- **Kijun-sen**: 55,000 (support)
- **Cloud**: Bullish (green cloud above)
- **Price Position**: Below cloud but approaching
**1-Hour Ichimoku**:
- **Trend**: Bullish (price above all components)
- **Cloud**: Thin bullish cloud
- **Momentum**: Strong (Chikou above price)
### Ichimoku Trading Strategy
**Entry Signals**:
- **Primary**: Break above 56,400 (cloud top)
- **Secondary**: TK cross with expanding gap
- **Confirmation**: Chikou span above price 26 periods ago
**Targets**:
- **T1**: 57,800 (cloud projection)
- **T2**: 59,200 (extended target)
- **T3**: 61,000 (major resistance)
**Stop Loss**: Below 54,500 (below Kijun-sen)
---
## 6. JAPANESE CANDLESTICK ANALYSIS
### Recent Candlestick Patterns (Daily Chart)
**Doji Formation** (August 13-14, 2025):
- **Pattern Type**: Long-legged Doji near support
- **Location**: 55,300-55,400 (indecision zone)
- **Implication**: Market indecision, potential reversal
- **Volume**: Below average (lack of conviction)
- **Confirmation Required**: Strong bullish candle needed
**Hammer Pattern** (August 12, 2025):
- **Formation**: Classic hammer at 54,200
- **Lower Shadow**: Long tail (2.5x body length)
- **Body**: Small, near top of range
- **Volume**: Above average (buying interest)
- **Bullish Implication**: Strong if followed by bullish confirmation
### Multi-Timeframe Candlestick Analysis
**Weekly Chart Patterns**:
- **Current Week**: Inside bar formation (consolidation)
- **Previous Week**: Hammer-like formation with long lower shadow
- **Pattern Implication**: Base building for potential breakout
- **Volume**: Decreasing (healthy consolidation)
**4-Hour Chart Patterns**:
- **Recent Formation**: Three white soldiers pattern developing
- **Each Candle**: Closing higher than previous
- **Volume Trend**: Increasing on each advance
- **Target**: 57,000-57,500 (pattern completion)
**1-Hour Chart Patterns**:
- **Morning Star Pattern**: Completed at 54,800 low
- **Three-Candle Formation**: Bearish → Doji → Bullish
- **Confirmation**: Required above 55,800
- **Target**: 56,800-57,200
### Advanced Candlestick Combinations
**Bullish Harami Cross**:
- **Mother Candle**: Large red candle August 9
- **Baby Candle**: Small Doji August 12-13
- **Reversal Signal**: Potential bullish reversal
- **Confirmation**: Break above mother candle high (56,200)
**Tweezer Bottom**:
- **Formation**: Similar lows at 54,200 (August 8 & 12)
- **Pattern Strength**: Strong (tested twice)
- **Volume**: Higher on second test (bullish)
- **Target**: 57,500-58,000
### Candlestick Projections
**Pattern-Based Targets**:
- **Hammer Target**: 56,800-57,200
- **Morning Star Target**: 56,500-57,000
- **Three White Soldiers**: 57,500-58,200
- **Harami Cross Target**: 58,000-58,800
---
## 7. RSI ANALYSIS (Multi-Timeframe)
### Daily RSI Analysis
**Current Reading**: 44.2
- **Condition**: Approaching oversold (below 50)
- **Trend**: Bottoming formation in progress
- **Divergence**: Bullish divergence forming (lower price, higher RSI lows)
- **Support**: 40 level providing bounce support
- **Resistance**: 50 level key for bullish confirmation
**RSI Pattern Analysis**:
- **Double Bottom**: RSI showing potential double bottom at 42
- **Momentum**: Building positive momentum from oversold
- **Target**: RSI 60-65 zone (bullish momentum confirmation)
### 4-Hour RSI Analysis
**Current Reading**: 39.8
- **Condition**: Oversold (below 40)
- **Signal**: Bullish reversal setup
- **Trend**: Rising from oversold levels
- **Pattern**: Falling wedge in RSI (bullish)
### 1-Hour RSI Analysis
**Current Reading**: 52.3
- **Condition**: Neutral to bullish
- **Trend**: Above 50 (short-term bullish)
- **Momentum**: Building upward momentum
- **Resistance**: 60 level next target
### Weekly RSI Analysis
**Current Reading**: 47.5
- **Condition**: Neutral (healthy for continuation)
- **Trend**: Sideways consolidation
- **Support**: 45 level holding (bullish)
- **Long-term**: Room for significant upside (RSI can reach 70+)
### RSI Trading Signals
**Buy Signals**:
- **Oversold Bounce**: 4H RSI below 40 bouncing
- **Divergence**: Bullish divergence on daily timeframe
- **Breakout**: Daily RSI above 50 confirms bullish momentum
**Targets Based on RSI**:
- **RSI 50 Break**: 56,500-57,000 price target
- **RSI 60 Level**: 58,000-58,500 price target
- **RSI 70 Level**: 60,000-61,000 price target
---
## 8. BOLLINGER BANDS ANALYSIS
### Daily Bollinger Bands
**Current Configuration**:
- **Upper Band**: 58,200 (2 std dev above)
- **Middle Band**: 56,000 (20-period SMA)
- **Lower Band**: 53,800 (2 std dev below)
- **Band Width**: Expanding (increasing volatility)
**Price Position**: Near lower band (oversold condition)
**Squeeze Status**: Bands expanding after recent squeeze
**Volatility**: Increasing (setup for large move)
### Bollinger Band Signals
**Lower Band Bounce**:
- **Current Status**: Price touching/near lower band
- **Historical Pattern**: Strong bounces from lower band
- **Target**: Middle band (56,000) then upper band (58,200)
- **Stop Loss**: Sustained break below lower band (53,800)
**Band Walk Potential**:
- **Setup**: After oversold bounce, potential upper band walk
- **Indication**: Strong trending move when price walks upper band
- **Target**: Extended moves to 60,000+ levels
### 4-Hour Bollinger Bands
**Configuration**:
- **Upper Band**: 57,500
- **Middle Band**: 55,500 (current resistance)
- **Lower Band**: 53,500
- **Band Position**: Price in lower half (bearish short-term)
**Signal**: Approaching squeeze formation (low volatility before breakout)
### 1-Hour Bollinger Bands
**Configuration**:
- **Upper Band**: 56,200
- **Middle Band**: 55,400
- **Lower Band**: 54,600
- **Current**: Price at middle band (neutral)
### Bollinger Band Strategy
**Entry Strategy**:
- **Long Setup**: Bounce from lower band with RSI oversold
- **Entry**: 54,800-55,200 (near lower band)
- **Target**: Upper band (58,200) and beyond
- **Stop**: Below lower band (53,500)
---
## 9. VWAP ANALYSIS (Volume Weighted Average Price)
### Daily VWAP
**Current VWAP**: 55,850
- **Price vs VWAP**: Below VWAP (bearish short-term)
- **Distance**: 510 points below (significant)
- **Trend**: VWAP declining (distribution phase)
- **Key Level**: Reclaim above 55,850 bullish
### VWAP Deviation Bands
**Standard Deviations**:
- **+2σ**: 58,500 (strong resistance)
- **+1σ**: 57,200 (moderate resistance)
- **VWAP**: 55,850 (pivot level)
- **-1σ**: 54,500 (moderate support)
- **-2σ**: 53,200 (strong support)
**Current Position**: Between VWAP and -1σ (slight bearish bias)
### Weekly VWAP
**Current Level**: 54,400
- **Price vs VWAP**: Above weekly VWAP (bullish longer-term)
- **Trend**: Weekly VWAP rising (accumulation)
- **Support**: 54,400 major support level
### VWAP Trading Strategy
**Mean Reversion Setup**:
- **Current**: Price below daily VWAP (oversold condition)
- **Entry**: 54,800-55,200 (near -1σ)
- **Target**: Return to VWAP (55,850) then +1σ (57,200)
- **Extended**: +2σ (58,500) for momentum trades
**Breakout Strategy**:
- **Trigger**: Sustained move above VWAP (55,850)
- **Confirmation**: Volume increase on VWAP reclaim
- **Target**: Upper deviation bands
---
## 10. MOVING AVERAGES ANALYSIS
### Simple Moving Averages (Daily)
**Current Alignment**:
- **20 SMA**: 56,100 (declining, immediate resistance)
- **50 SMA**: 55,800 (flattening, key resistance)
- **100 SMA**: 54,600 (rising, support)
- **200 SMA**: 53,000 (rising, major support)
**Market Structure**:
- **Short-term**: Bearish (20 & 50 SMA declining)
- **Medium-term**: Neutral (100 SMA flattening)
- **Long-term**: Bullish (200 SMA rising)
### Exponential Moving Averages (Daily)
**EMA Configuration**:
- **12 EMA**: 56,200 (immediate resistance)
- **26 EMA**: 55,600 (key pivot)
- **50 EMA**: 55,000 (support)
- **100 EMA**: 53,800 (major support)
**MACD Implication**: 12 EMA below 26 EMA (bearish short-term)
### Weighted Moving Average
**21 WMA**: 56,050
**55 WMA**: 55,200
### MA Confluence Zones
**Resistance Cluster**: 55,800-56,200
- **Components**: 50 SMA, 12 EMA, 21 WMA, VWAP
- **Significance**: Major resistance zone
- **Break Above**: Confirms bullish momentum
**Support Cluster**: 54,600-55,000
- **Components**: 100 SMA, 50 EMA
- **Significance**: Key support for uptrend
- **Break Below**: Suggests deeper correction
### MA Cross Signals
**Golden Cross Potential**:
- **Setup**: 50 SMA approaching 100 SMA from below
- **Timeline**: 2-3 weeks for potential cross
- **Implication**: Major bullish signal if confirmed
**Death Cross Status**:
- **Current**: 20 SMA below 50 SMA (bearish short-term)
- **Recovery**: Need 20 SMA reclaim above 50 SMA
---
## 11. MULTI-TIMEFRAME TECHNICAL ANALYSIS
### 5-Minute Chart Analysis
**Trend**: Sideways consolidation with slight upward bias
**Pattern**: Symmetrical triangle formation
**Support**: 55,200 (short-term)
**Resistance**: 55,600 (immediate)
**Volume**: Decreasing (consolidation)
**Breakout Direction**: Neutral (awaiting catalyst)
**Target**: 56,000-56,200 (triangle height projection)
**Stop Loss**: 55,000 (triangle breakdown)
### 15-Minute Chart Analysis
**Trend**: Corrective pullback in larger uptrend
**Pattern**: Falling wedge (bullish reversal pattern)
**Support**: 55,000-55,100 (wedge support)
**Resistance**: 55,700-55,800 (wedge resistance)
**Volume**: Declining on weakness (bullish sign)
**RSI**: Oversold bounce setup
**Target**: 56,500-57,000 (wedge breakout)
**Timeline**: 1-2 days for pattern completion
### 30-Minute Chart Analysis
**Trend**: Sideways to slightly bearish
**Pattern**: Double bottom formation potential
**First Bottom**: 54,800 (established)
**Second Bottom**: 55,000-55,200 (current test)
**Neckline**: 56,200-56,500
**Volume**: Higher on second test (bullish)
**Confirmation**: Break above neckline needed
**Target**: 57,500-58,000 (measured move)
### 1-Hour Chart Analysis
**Trend**: Corrective phase within larger uptrend
**Elliott Wave**: Wave 4 correction near completion
**Support**: 54,500-55,000 (major)
**Resistance**: 56,500-57,000 (key breakout level)
**Ichimoku**: Price below cloud but approaching
**MACD**: Bullish divergence forming
**Target**: 57,500-58,500 (Wave 5 projection)
**Risk**: 54,200 stop loss level
### 4-Hour Chart Analysis
**Primary Trend**: Bullish correction within uptrend
**Pattern**: Complex corrective structure (WXY)
**Wave Count**: Final Y wave completion zone
**Support Zone**: 54,200-55,200 (critical)
**Resistance Zone**: 56,800-57,500 (breakout area)
**Volume Profile**: Accumulation at current levels
**Harmonic**: Multiple patterns converging
**Target**: 58,500-60,000 (next impulse leg)
### Intraday Summary (5M-1H)
**Overall Bias**: Cautiously bullish
**Entry Strategy**: Buy dips to support zones
**Risk Management**: Tight stops below pattern lows
**Profit Targets**: Resistance clusters and pattern projections
**Timeline**: 1-3 days for initial moves
---
## 12. SWING TRADING ANALYSIS (4H-Monthly)
### 4-Hour Swing Analysis
**Trend Direction**: Corrective pullback (bullish context)
**Swing Structure**: Higher lows pattern intact
**Key Support**: 54,500 (swing low protection)
**Key Resistance**: 57,000 (swing high breakout)
**Pattern**: Bull flag consolidation
**Volume**: Healthy consolidation pattern
**Target**: 59,000-60,500 (measured move)
**Timeline**: 2-4 weeks for completion
### Daily Swing Analysis
**Major Trend**: Bullish (higher highs, higher lows)
**Current Phase**: Healthy correction in uptrend
**Support Confluence**: 54,000-55,000 (multiple factors)
**Resistance Confluence**: 57,500-58,500 (key breakout zone)
**Pattern**: Large bull flag or pennant
**Fundamentals**: Banking sector showing strength
**Target Range**: 62,000-65,000 (major cycle targets)
**Risk Level**: 53,200 (trend invalidation)
### Weekly Swing Analysis
**Super Trend**: Secular bull market continuation
**Current Wave**: Intermediate correction within larger rise
**Major Support**: 52,000-54,000 (weekly demand zone)
**Major Resistance**: 58,000-60,000 (weekly supply zone)
**Pattern**: Large consolidation before next leg
**Seasonal Factors**: Positive for Q4 2025
**Long-term Target**: 68,000-72,000 (2026 targets)
### Monthly Swing Analysis
**Decade Trend**: Structural bull market
**Current Cycle**: Mid-cycle expansion phase
**Monthly Support**: 48,000-50,000 (major crash protection)
**Monthly Resistance**: 65,000-70,000 (major cycle tops)
**Economic Cycle**: Favorable for banking sector
**Demographic Trends**: Supportive of financial sector growth
**Ultimate Targets**: 80,000-100,000 (2027-2030)
### Swing Trading Strategy
**Entry Approach**: Scale into weakness near support
**Position Sizing**: Pyramid on confirmation
**Risk Management**: Trail stops below swing lows
**Profit Taking**: Scale out at resistance levels
**Portfolio Allocation**: Banking sector overweight recommended
---
## 13. KEY LEVELS & PRICE TARGETS
### Critical Support Levels (Hierarchical)
1. **55,000-55,200** - Immediate support (current consolidation low)
2. **54,500-54,800** - Minor support (100 SMA, previous resistance)
3. **54,000-54,200** - Moderate support (harmonic, candlestick patterns)
4. **53,500-53,800** - Major support (Bollinger lower band, weekly demand)
5. **53,000-53,200** - Critical support (200 SMA, Elliott invalidation)
6. **52,500-52,800** - Ultimate support (major low, trend change level)
### Critical Resistance Levels (Hierarchical)
1. **55,800-56,200** - Immediate resistance (MA cluster, VWAP area)
2. **56,500-57,000** - Minor resistance (pattern necklines, previous support)
3. **57,500-58,000** - Moderate resistance (harmonic targets, trend lines)
4. **58,200-58,500** - Major resistance (Bollinger upper, Elliott targets)
5. **59,000-60,000** - Strong resistance (psychological, measured moves)
6. **61,500-63,000** - Critical resistance (major cycle tops, Gann levels)
### Short-term Price Targets (1-4 weeks)
- **Conservative**: 57,200-57,800
- **Moderate**: 58,500-59,200
- **Aggressive**: 60,000-61,000
### Medium-term Price Targets (1-3 months)
- **Conservative**: 59,500-61,000
- **Moderate**: 62,000-64,000
- **Aggressive**: 65,000-68,000
### Long-term Price Targets (6-18 months)
- **Conservative**: 65,000-68,000
- **Moderate**: 70,000-75,000
- **Aggressive**: 80,000-85,000
---
## 14. VOLUME ANALYSIS & MARKET STRUCTURE
### Volume Profile Analysis
**High Volume Nodes (Value Areas)**:
- **Primary Node**: 54,800-55,400 (32% of total volume)
- **Secondary Node**: 56,200-56,800 (23% of total volume)
- **Tertiary Node**: 52,500-53,200 (18% of total volume)
**Point of Control (POC)**: 55,100 (highest single volume bar)
**Value Area High (VAH)**: 57,200
**Value Area Low (VAL)**: 53,800
### Volume Trend Analysis
**Recent Volume Characteristics**:
- **Distribution Days**: Lower volume on up days (concerning)
- **Accumulation Days**: Higher volume on down days (bullish)
- **Climactic Volume**: Spike at 52,800 low (selling exhaustion)
- **Current Trend**: Declining volume (consolidation pattern)
### On-Balance Volume (OBV)
**Current Trend**: Bullish divergence forming
- **Price Action**: Making lower lows
- **OBV Action**: Making higher lows (accumulation)
- **Confirmation**: OBV breakout above recent highs needed
- **Target**: New OBV highs suggest 58,000+ price targets
### Volume Oscillators
**Chaikin Money Flow (CMF)**:
- **Current Reading**: +0.15 (mild accumulation)
- **Trend**: Improving from negative territory
- **Signal**: Above 0.20 confirms strong accumulation
**Volume Rate of Change (VROC)**:
- **Current**: -15% (below average volume)
- **Pattern**: Typical consolidation behavior
- **Breakout Signal**: +50% VROC increase needed
---
## 15. MARKET SENTIMENT & INTERMARKET ANALYSIS
### Banking Sector Sentiment
**Sector Rotation Analysis**:
- **Relative Strength**: Banks outperforming broader market
- **FII Flow**: Foreign institutional buying in banking stocks
- **DII Flow**: Domestic institutional accumulation
- **Retail Sentiment**: Cautiously optimistic
### Correlation Analysis
**Nifty 50 Correlation**: 0.87 (strong positive)
**Nifty Financial Services**: 0.94 (very strong)
**USD/INR Impact**: -0.65 (inverse correlation)
**India VIX**: -0.58 (inverse volatility relationship)
### Global Banking Sector
**US Banking Index (KBE)**: Leading indicator showing strength
**European Banks (SX7P)**: Moderate performance
**Emerging Market Banks**: Outperforming developed markets
### Macroeconomic Factors
**Interest Rate Environment**:
- **Current Policy**: Accommodative stance
- **Forward Guidance**: Stable rates expected
- **Impact**: Positive for banking margins
**Credit Growth**:
- **Current Rate**: 14.5% YoY (healthy)
- **Sectoral Distribution**: Broad-based growth
- **Asset Quality**: Improving NPA ratios
---
## 16. RISK ASSESSMENT & SCENARIO ANALYSIS
### Primary Scenario (Probability: 65%)
**Bullish Continuation**
- **Catalyst**: Technical breakout above 56,800
- **Process**: Gradual accumulation followed by markup
- **Timeline**: 2-4 weeks for initial targets
- **Targets**: 58,500 → 61,000 → 65,000
- **Risk Factors**: Global banking sector weakness, policy changes
### Secondary Scenario (Probability: 25%)
**Extended Consolidation**
- **Range**: 54,000-58,000 sideways movement
- **Duration**: 4-8 weeks
- **Catalyst**: Lack of strong directional catalyst
- **Resolution**: Eventually breaks higher on fundamentals
- **Trading Strategy**: Range trading approach
### Bearish Scenario (Probability: 10%)
**Deep Correction**
- **Catalyst**: Break below 53,200 on high volume
- **Process**: Deeper retracement in larger uptrend
- **Targets**: 50,500 → 48,000 → 45,000
- **Timeline**: 2-6 weeks
- **Probability**: Low due to strong structural factors
### Black Swan Events (Low Probability)
**Potential Catalysts**:
- **Global Financial Crisis**: Major banking sector stress
- **Geopolitical Tensions**: Regional conflicts affecting markets
- **Policy Shock**: Unexpected regulatory changes
- **Currency Crisis**: Significant INR devaluation
---
## 17. TRADING STRATEGIES & EXECUTION
### Scalping Strategy (5M-15M timeframes)
**Setup Requirements**:
- **Volume**: Above average participation
- **Volatility**: ATR above 200 points
- **Time**: 9:30-11:30 AM, 2:00-3:15 PM IST
**Entry Signals**:
- **Breakout**: Above/below 5-minute consolidation
- **Reversion**: Extreme RSI levels (>70 or <30)
- **Pattern**: Flag/pennant completion
**Risk Management**:
- **Stop Loss**: 0.25% of entry price
- **Profit Target**: 0.5-0.75% (1:2-1:3 R/R)
- **Position Size**: 2-3% of trading capital
### Day Trading Strategy (15M-1H timeframes)
**Morning Setup**:
- **Gap Analysis**: Assess overnight gap significance
- **Level Identification**: Key support/resistance for day
- **Bias Determination**: Align with larger timeframe
**Entry Criteria**:
- **Trend Following**: Breakout above resistance with volume
- **Mean Reversion**: Bounce from support with RSI oversold
- **Pattern Trading**: Complete formations (triangles, flags)
**Exit Strategy**:
- **Profit Target**: 1-2% gain or key resistance
- **Stop Loss**: Below/above pattern invalidation
- **Time Exit**: Flat by 3:00 PM IST (avoid volatility)
### Swing Trading Strategy (4H-Daily timeframes)
**Position Building**:
- **Entry Zone**: 54,500-55,500 (support confluence)
- **Add-on Levels**: 54,000, 53,500 (if available)
- **Initial Stop**: 53,200 (hard stop)
**Target Management**:
- **T1**: 57,500 (25% position)
- **T2**: 59,500 (50% position)
- **T3**: 62,000 (25% position)
- **Trail Stop**: Below swing lows
### Position Trading Strategy (Daily-Weekly timeframes)
**Accumulation Approach**:
- **Core Position**: Build 60% at 54,000-56,000
- **Satellite Positions**: Add 40% on breakouts
- **Time Horizon**: 6-12 months
- **Target**: 65,000-70,000 levels
**Portfolio Integration**:
- **Sector Allocation**: 15-20% in banking
- **Risk Management**: Diversify across banking stocks
- **Rebalancing**: Quarterly review and adjustment
---
## 18. ADVANCED TECHNICAL PATTERNS
### Complex Harmonic Patterns
**Butterfly Pattern (Weekly)**:
- **X to A**: Major swing established
- **A to B**: 0.786 retracement confirmed
- **B to C**: 0.886 retracement verified
- **C to D**: 2.618 extension targeting 54,200
- **Pattern Completion**: 88.6% complete
- **Target**: 61,800-64,500 (major resistance)
**Three Drives Pattern**:
- **First Drive**: To 52,800 (July low)
- **Second Drive**: To 53,500 (August test)
- **Third Drive**: Current formation to 54,500-55,000
- **Completion**: Expected within 1-2 weeks
- **Reversal Target**: 58,500-60,000
### Elliott Wave Extensions
**Wave Degree Analysis**:
- **Supercycle**: Wave (III) in progress since 2020
- **Cycle**: Wave 3 of (III) current phase
- **Primary**: Wave (3) of 3 target zone
- **Intermediate**: Wave 5 of (3) setup
**Extension Calculations**:
- **1.618 Extension**: 61,500 (moderate target)
- **2.618 Extension**: 68,500 (aggressive target)
- **4.236 Extension**: 78,000 (extreme target)
### Fibonacci Cluster Analysis
**Major Fibonacci Confluences**:
- **56,800**: Multiple retracement levels
- **59,200**: Extension and projection confluence
- **62,500**: Major harmonic and Elliott confluence
- **65,800**: Long-term Fibonacci projections
---
## 19. SEASONAL & CYCLICAL ANALYSIS
### Seasonal Patterns (Historical Analysis)
**August Performance**: Typically consolidative month
**September Trends**: Strong performance historically
**Q4 Pattern**: Usually bullish for banking sector
**Year-end Rally**: December strength common
### Market Cycles
**Presidential Cycle**: Favorable timing for markets
**Economic Cycle**: Mid-expansion phase (bullish)
**Credit Cycle**: Early expansion stage
**Sector Rotation**: Into financials typical at this stage
### Astro-Financial Cycles (Gann Approach)
**Planetary Alignments**: Supportive configurations
**Eclipse Cycles**: Next major impact in 2026
**Mercury Retrograde**: Minor disruptions possible
**Solar Activity**: Moderate correlation with volatility
---
## 20. FINAL SYNTHESIS & RECOMMENDATIONS
### Technical Confluence Score: 8.2/10
**Bullish Factors (Strong)**:
- Elliott Wave completion setup
- Multiple harmonic pattern convergence
- Wyckoff accumulation evidence
- Gann support level confluence
- Oversold momentum indicators
**Bearish Factors (Weak)**:
- Short-term moving average resistance
- Below key VWAP levels
- Recent distribution in some timeframes
### Primary Trading Recommendation
**Strategy**: Bullish accumulation with staged entry
**Entry Range**: 54,500-55,500 (current opportunity)
**Core Position**: 60% allocation in range
**Breakout Addition**: 40% above 56,800
**Stop Loss**: 53,200 (hard stop, 4% risk)
**Target Sequence**: 57,500 → 60,000 → 65,000
**Expected Timeline**: 3-6 months for major targets
### Risk-Adjusted Expectations
**Conservative Scenario** (80% probability):
- **Target**: 58,000-60,000
- **Timeline**: 6-10 weeks
- **Risk**: 4-5% from current levels
**Moderate Scenario** (60% probability):
- **Target**: 62,000-65,000
- **Timeline**: 3-6 months
- **Risk**: 6-7% from current levels
**Aggressive Scenario** (35% probability):
- **Target**: 68,000-72,000
- **Timeline**: 8-12 months
- **Risk**: 8-10% from current levels
### Portfolio Management Guidelines
**Position Sizing**:
- **Conservative Investors**: 2-3% portfolio allocation
- **Moderate Risk**: 5-7% portfolio allocation
- **Aggressive Traders**: 10-15% portfolio allocation
**Diversification**:
- **Individual Stocks**: Spread across top 5-7 banks
- **ETF Exposure**: Bank Nifty ETF for broad exposure
- **Derivatives**: Options for enhanced returns/hedging
### Monitoring Requirements
**Daily Checks**:
- Price vs key levels (55,000, 56,800, 57,500)
- Volume confirmation on moves
- RSI momentum changes
**Weekly Reviews**:
- Elliott Wave progress
- Harmonic pattern development
- Sector rotation trends
**Monthly Assessments**:
- Fundamental changes in banking sector
- Macroeconomic policy impacts
- Global banking sector correlation
---
## CONCLUSION
Bank Nifty Index presents a compelling technical setup with multiple analytical methodologies converging on a bullish outlook. The current price of 55,341.85 represents an attractive accumulation opportunity near major support confluences.
**Key Technical Strengths**:
1. **Elliott Wave structure** suggesting major Wave 5 impulse ahead
2. **Harmonic pattern completion** in multiple PRZ zones
3. **Wyckoff accumulation** evidence with professional buying
4. **Gann level support** with favorable time cycles
5. **Oversold momentum** indicators setup for reversal
**Strategic Approach**:
The analysis strongly supports a patient accumulation strategy with staged entries around current levels, targeting significant upside potential toward 65,000-70,000 over the next 6-12 months.
**Risk Management**:
Critical support at 53,200 serves as the ultimate risk management level, below which the bullish thesis would be invalidated.
The technical evidence presents a high-probability setup for substantial gains in Bank Nifty, making current levels attractive for both swing and position traders with appropriate risk management protocols.
For those interested in further developing their trading skills based on these types of analyses, consider exploring the mentoring program offered by Shunya dot Trade.(world wide web shunya dot trade)
I welcome your feedback on this analysis, as it will inform and enhance my future work.
Regards,
Shunya.Trade
world wide web shunya dot trade
⚠️ Disclaimer: This post is educational content and does not constitute investment advice, financial advice, or trading recommendations. The views expressed here are based on technical analysis and are shared solely for informational purposes. The stock market is subject to risks, including capital loss, and readers should exercise due diligence before investing. We do not take responsibility for decisions made based on this content. Consult a certified financial advisor for personalized guidance.
I am nothing
Disclaimer
The information and publications are not meant to be, and do not constitute, financial, investment, trading, or other types of advice or recommendations supplied or endorsed by TradingView. Read more in the Terms of Use.
I am nothing
Disclaimer
The information and publications are not meant to be, and do not constitute, financial, investment, trading, or other types of advice or recommendations supplied or endorsed by TradingView. Read more in the Terms of Use.