Intro for 17-Oct-2024 Chart Pattern
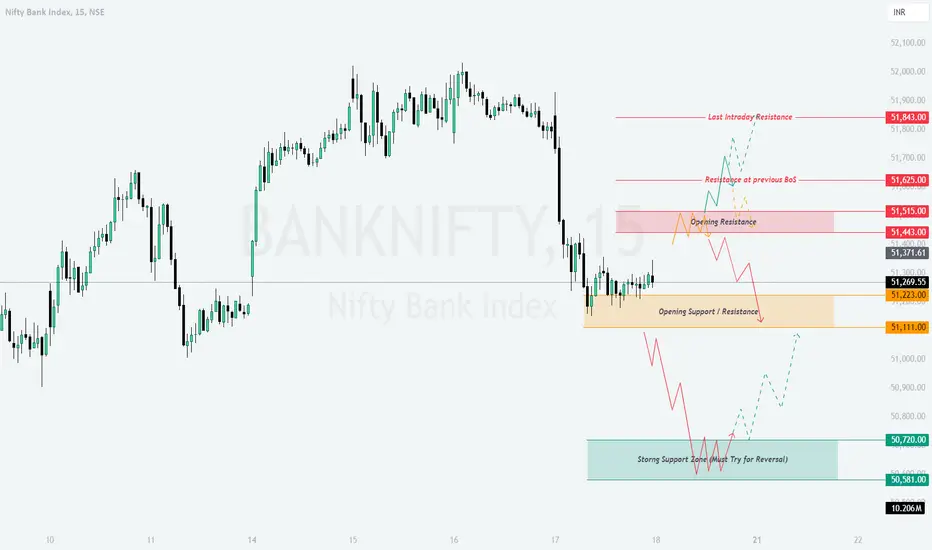
The Bank Nifty traded with high volatility on 17-Oct-2024, respecting key levels marked in the previous analysis. After attempting to break the last intraday resistance around **51,843**, prices faced rejection and retraced back, testing lower support zones. The day ended with a modest consolidation, hovering around the **51,269.55** mark, hinting at a possible range-bound movement or a significant move depending on how the market opens on 18-Oct-2024.
---
Trading Plan for 18-Oct-2024:
1. Gap Up Opening (+200 points from previous close around 51,269):
- If Bank Nifty opens above **51,515** (Opening Resistance zone), watch for price rejection around **51,625**. Look for shorting opportunities if there is an early pullback, targeting the **51,269** level as the first support.
- In case of sustained buying, with a strong break above **51,625**, wait for a retest and consider buying above this level. A target of **51,843** (last intraday resistance) can be set for this scenario.
- Keep a tight stop-loss at **51,443** on the downside if you are going long after the retest of **51,625**.
---
2. Flat Opening (Near previous close 51,269):- For a flat opening near **51,269**, the immediate level to watch will be **51,223**. If prices stay below this level in the first 30 minutes, it could indicate bearish pressure. Consider shorting below **51,223**, targeting **51,111** initially.
- If prices bounce back above **51,269**, we can expect a move toward **51,443** and possibly towards the **51,515** resistance level. A long trade can be taken if there is a strong hourly candle close above **51,443**.
- Use a stop-loss near **51,111** if taking long positions above **51,443**, as this level represents strong rejection potential.
---
3. Gap Down Opening (-200 points from previous close around 51,269):- A gap down opening near **51,111** would bring the strong support zone into play. Watch for a reversal sign near **51,111**. If there is a rejection of lower levels, one can consider buying here with a target of **51,223** for a quick scalp trade.
- If selling pressure continues and prices break below **51,111**, expect further downside towards **50,720** (Strong Support Zone). A breakdown here can lead to a larger move targeting **50,581**. Consider short positions below **51,111** for this setup.
- Use a stop-loss above **51,111** if initiating short trades below this zone to protect against sudden reversals.
---
**Risk Management Tips for Options Trading:**- When trading options, always define your maximum risk beforehand. For intraday trades, avoid holding naked options and consider using spreads to limit losses.
- Avoid trading OTM options during volatile conditions to prevent rapid time decay and premium erosion.
- Keep position sizes small when volatility is high, especially near critical levels like **51,515** or **51,111**, where sharp reversals are likely.
- Consider hedging directional bets with a defined risk strategy, such as buying a put/call spread instead of naked long/short positions.
---
**Summary and Conclusion:**
For 18-Oct-2024, key levels to watch include **51,515** on the upside and **51,111** on the downside. A gap-up scenario could bring early shorting opportunities near **51,625**, while a gap-down may test the **51,111** support for a potential reversal. For flat openings, patience is required, allowing prices to settle before entering trades. Tight risk management, especially in options trading, is crucial due to expected volatility.
---
**Disclaimer:** I am not a SEBI-registered analyst. All levels and views are based on technical and psychological analysis, and traders should do their own research or consult a financial advisor before making any trading decisions.
- When trading options, always define your maximum risk beforehand. For intraday trades, avoid holding naked options and consider using spreads to limit losses.
- A gap down opening near **51,111** would bring the strong support zone into play. Watch for a reversal sign near **51,111**. If there is a rejection of lower levels, one can consider buying here with a target of **51,223** for a quick scalp trade.
- For a flat opening near **51,269**, the immediate level to watch will be **51,223**. If prices stay below this level in the first 30 minutes, it could indicate bearish pressure. Consider shorting below **51,223**, targeting **51,111** initially.
Disclaimer
The information and publications are not meant to be, and do not constitute, financial, investment, trading, or other types of advice or recommendations supplied or endorsed by TradingView. Read more in the Terms of Use.
Disclaimer
The information and publications are not meant to be, and do not constitute, financial, investment, trading, or other types of advice or recommendations supplied or endorsed by TradingView. Read more in the Terms of Use.