🔎 Market Recap:
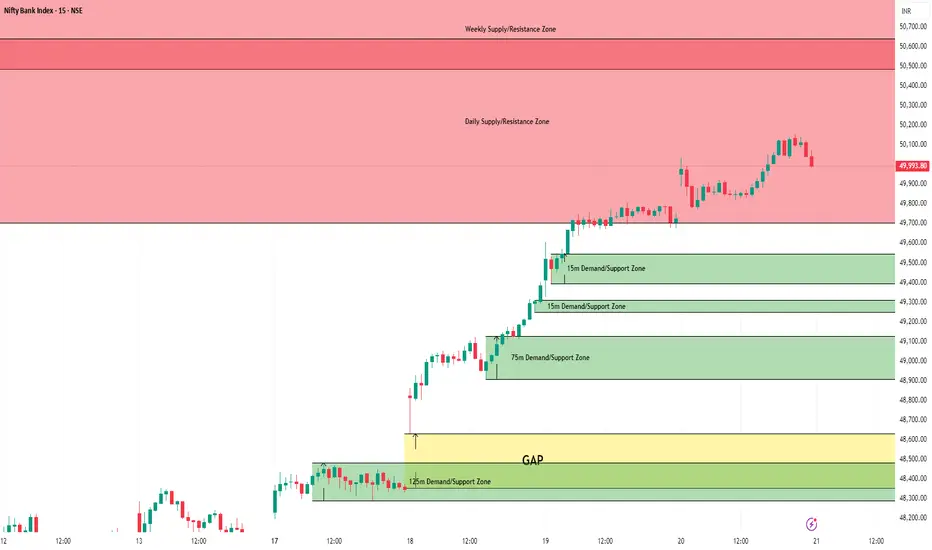
On Thursday, BankNifty opened gap-up, dipped to a low of 49,771.65, and then rallied to a high of 50,155.30, penetrating deep into the Daily Supply Zone (49,703.10 - 50,641.75). It closed at 50,062.85, gaining 360 points over the previous close.
📉 Trend Analysis:
Weekly Trend (50 SMA): Turned sideways from negative, but confirmation depends on Friday’s close.
Daily Trend (50 SMA): Sideways.
📉 Demand/Support Zones
Near Demand/Support (15m): 49,394.40 - 49,546.60
Near Demand/Support (15m): 49,249.15 - 49,309.55
Far Demand/Support (75m): 48,908.20 - 49,125.55
Far Demand/Support (125m): 48,288.30 - 48,481.35
Far Support: Around 47,850 (Multiple Daily Chart supports)
Far Support: 46,077.85 (Low of 4th June 2024)
Far Demand/Support (Daily): 44,633.85 - 45,750.40
📈 Supply/Resistance Zones
Near Supply/Resistance (Daily): 49,703.10 - 50,641.75 (Currently trading inside)
Far Supply/Resistance (Weekly): 50,485.05 - 51,979.75 (Tested once)
Far Supply/Resistance (Weekly): 52,264.55 - 53,775.10
💡 Outlook:
BankNifty is now inside a major Daily Supply Zone, making this a key resistance area to watch. If price sustains above 50,641, we could see a continuation toward the Weekly Supply Zone at 51,979. However, failure to break this zone could trigger a retracement toward 49,400 - 49,250.
📢 Disclaimer:
This analysis is for educational and informational purposes only and should not be considered as financial advice. Trading and investing in the stock market involve risk, and past performance does not guarantee future results. Always conduct your own research and consult with a certified financial advisor before making any trading decisions. The author is not responsible for any financial losses incurred based on this analysis.
Related publications
Disclaimer
The information and publications are not meant to be, and do not constitute, financial, investment, trading, or other types of advice or recommendations supplied or endorsed by TradingView. Read more in the Terms of Use.
Related publications
Disclaimer
The information and publications are not meant to be, and do not constitute, financial, investment, trading, or other types of advice or recommendations supplied or endorsed by TradingView. Read more in the Terms of Use.