📈 Trade Setup Details
🔹 Trade Plan 1 (MTF-Based Entry)
Metric Value
Entry 56,223
Stop Loss 55,475
Risk 748 pts
Target 63,232
Reward 7,009 pts
Risk:Reward 1:9.4
🔸 Comment:
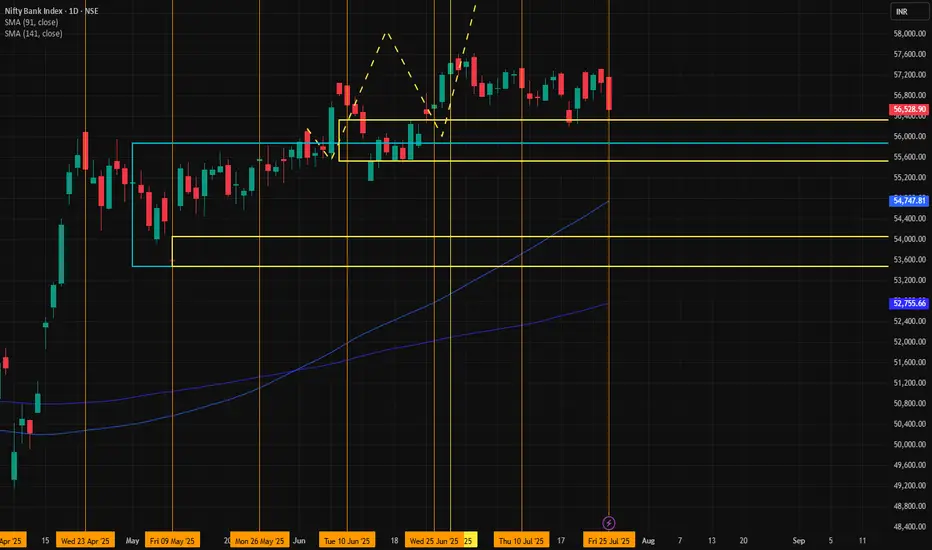
A high RR setup using the Daily DMIP zone. Ideal for trend continuation if price respects 55,780–56,223 range.
🔹 Trade Plan 2 (Deep Pullback Entry - ITF Zone)
Metric Value
Entry 54,054
Stop Loss 53,483
Risk 571 pts
Target 61,819
Reward 7,765 pts
Risk:Reward 1:13.6
🔸 Comment:
An aggressive RR trade if price retraces. Very favorable for swing traders anticipating bounce from deeper ITF demand zone.
🧭 Technical Landmarks
Key Level Value
Last High 55,467
Last Low 47,702
Point Range 7,765
🧠 Strategic Notes
Bias: Strong Bullish.
Preferred Entry: If price reacts bullishly at 56,223, can trigger first trade. If market dips, watch 54,054 for second trade.
Stop Loss Discipline: Clearly placed with low drawdown.
Trend Confirmation: All HTF zones are bullish, adding confidence to long entries.
🔍 Multi-Timeframe (MTF) Analysis Summary
Timeframe Trend Zone Type Proximal Distal Average
Yearly UP Rally-Base-Rally 54,467 44,429 49,448
Half-Yearly UP BUFL 54,467 49,654 52,061
Quarterly UP Rally-Base-Rally 54,467 49,156 51,812
HTF Avg. UP 54,467 47,746 51,107
| Monthly | UP | Rally-Base-Rally | 55,875 | 53,483 | 54,679 |
| Weekly | UP | Rally-Base-Rally | 56,328 | 55,381 | 55,855 |
| Daily | UP | DMIP (BUFL) | 56,223 | 55,780 | 56,002 |
| MTF Avg. | UP | | 56,142 | 54,881 | 55,512 |
| 240m | UP | DMIP | 55,942 | 55,475 | 55,709 |
| 180m | UP | DMIP | 55,597 | 55,475 | 55,536 |
| 60m | UP | DMIP | 55,597 | 55,475 | 55,536 |
| ITF Avg. | UP | | 55,712 | 55,475 | 55,594 |
✅ Conclusion: All timeframes are bullish, with higher highs and strong demand zones developing across MTF and ITF — indicating a clear uptrend continuation structure.
🔹 Trade Plan 1 (MTF-Based Entry)
Metric Value
Entry 56,223
Stop Loss 55,475
Risk 748 pts
Target 63,232
Reward 7,009 pts
Risk:Reward 1:9.4
🔸 Comment:
A high RR setup using the Daily DMIP zone. Ideal for trend continuation if price respects 55,780–56,223 range.
🔹 Trade Plan 2 (Deep Pullback Entry - ITF Zone)
Metric Value
Entry 54,054
Stop Loss 53,483
Risk 571 pts
Target 61,819
Reward 7,765 pts
Risk:Reward 1:13.6
🔸 Comment:
An aggressive RR trade if price retraces. Very favorable for swing traders anticipating bounce from deeper ITF demand zone.
🧭 Technical Landmarks
Key Level Value
Last High 55,467
Last Low 47,702
Point Range 7,765
🧠 Strategic Notes
Bias: Strong Bullish.
Preferred Entry: If price reacts bullishly at 56,223, can trigger first trade. If market dips, watch 54,054 for second trade.
Stop Loss Discipline: Clearly placed with low drawdown.
Trend Confirmation: All HTF zones are bullish, adding confidence to long entries.
🔍 Multi-Timeframe (MTF) Analysis Summary
Timeframe Trend Zone Type Proximal Distal Average
Yearly UP Rally-Base-Rally 54,467 44,429 49,448
Half-Yearly UP BUFL 54,467 49,654 52,061
Quarterly UP Rally-Base-Rally 54,467 49,156 51,812
HTF Avg. UP 54,467 47,746 51,107
| Monthly | UP | Rally-Base-Rally | 55,875 | 53,483 | 54,679 |
| Weekly | UP | Rally-Base-Rally | 56,328 | 55,381 | 55,855 |
| Daily | UP | DMIP (BUFL) | 56,223 | 55,780 | 56,002 |
| MTF Avg. | UP | | 56,142 | 54,881 | 55,512 |
| 240m | UP | DMIP | 55,942 | 55,475 | 55,709 |
| 180m | UP | DMIP | 55,597 | 55,475 | 55,536 |
| 60m | UP | DMIP | 55,597 | 55,475 | 55,536 |
| ITF Avg. | UP | | 55,712 | 55,475 | 55,594 |
✅ Conclusion: All timeframes are bullish, with higher highs and strong demand zones developing across MTF and ITF — indicating a clear uptrend continuation structure.
Disclaimer
The information and publications are not meant to be, and do not constitute, financial, investment, trading, or other types of advice or recommendations supplied or endorsed by TradingView. Read more in the Terms of Use.
Disclaimer
The information and publications are not meant to be, and do not constitute, financial, investment, trading, or other types of advice or recommendations supplied or endorsed by TradingView. Read more in the Terms of Use.