BANKNIFTY index Statistics::
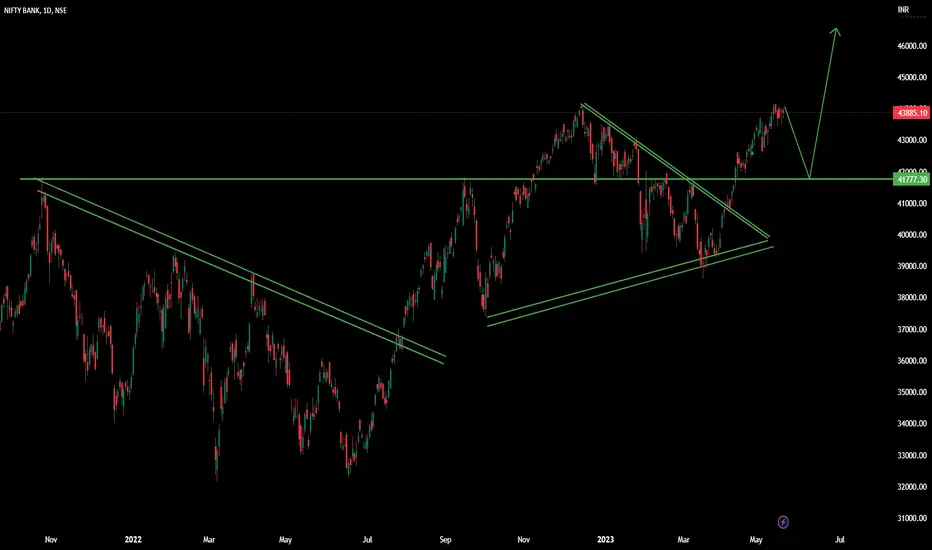
We have seen clearly a bullish movement from Start of April ,from 40600 levels.
April Month : Is said to be bullish price, rise from 40600 to 43200 - an overall of 2600 points moved upwards.
May Month:: 43200 -43800(Today) levels = Almost +500 points range.
If price falls below @43200 we can say that the overall month is bearish.
Consolidation::
------>>what is the sign of this huge upward momentum stops and trading in a range,
the price is clearly trading in a range bound, from last one month.
Will the range be broken, we have 3 days left for monthly expiry, can we expect any trending movements.
if this range is broken, we will observe a strong fall or strong rise is happens.
If we consider it as a rally base rally,
Rally from 40600 - 43200
Base from 43200-43800 Still bullish
Rally --- From 43800 -- 46400 levels. Make it Round to 46000.
Case 1:
If It is a Rally--Base--Rally, we can expect the next month to be bullish.
Case2:
If it is sign of reversal, we can say that it's still positive....So No bearish.
Case3::
If we expect some retracement , again we can say that bullish.
Strong Upward momentum + Consolidation = Retracement((again Bullish Continuation)).
So if retracement occurs, until which price we can expect, so if we see the technical chart
we don't have any strong bullish movement is observed,
every move depends on Resistance (Previous Resistances are pushing the price towards upside) ,acts as support and price moves upwards.

previous resistance @42000 pushed the price up, 43000 fall acts as support, and now 43600 fall is giving support to move again.
if price failed to acts as support @ 43600,we may expect a fall till 43000, and 42000.

Consider this as a retracement and be bullish from these levels. The last Hope.
This is another Scenario will explain Later Clearly::
From 46500 levels, if price started falling again we may see a strong sell of until 35000 and below is possible.
From bottom again price creates strong Demand Zones and moving again upwards.
so its clearly showing that we have only one last movement to bottom side that to 35000-34000 levels.
we have gaps below @ 35600 and @34400.
So clearly from 34000-35000 is the last move we can expect to the downside.
while breaking the previous resistance @41800 created on oct 2021, price fall back 4400 points.

After breaking the resistance price moved 2300 points from 41800 - 44200 levels.

now we are at the resistance 44200, if price fall from this levels,
we will expect the previous resistance @41800 level will push the price towards upside 2300 points from resistance, 44200+ 2300 = 46500 range.
If price failed to break the high 44200 level and breaks below 41800 then only think of sell side.
Elliott wave::
wave 1: 32300 to 41800
wave 2: 41800 to 37400
wave 3: 37400 to 44200
wave 4: 44200 to 38600
wave 5 : 38600 to 44200 + 2300 = 46500 levels.
If we consider the Elliott wave theory wave 5 is more than wave 3,

If this post is Helpful please Support me with like. Thanks
We have seen clearly a bullish movement from Start of April ,from 40600 levels.
April Month : Is said to be bullish price, rise from 40600 to 43200 - an overall of 2600 points moved upwards.
May Month:: 43200 -43800(Today) levels = Almost +500 points range.
If price falls below @43200 we can say that the overall month is bearish.
Consolidation::
------>>what is the sign of this huge upward momentum stops and trading in a range,
the price is clearly trading in a range bound, from last one month.
Will the range be broken, we have 3 days left for monthly expiry, can we expect any trending movements.
if this range is broken, we will observe a strong fall or strong rise is happens.
If we consider it as a rally base rally,
Rally from 40600 - 43200
Base from 43200-43800 Still bullish
Rally --- From 43800 -- 46400 levels. Make it Round to 46000.
Case 1:
If It is a Rally--Base--Rally, we can expect the next month to be bullish.
Case2:
If it is sign of reversal, we can say that it's still positive....So No bearish.
Case3::
If we expect some retracement , again we can say that bullish.
Strong Upward momentum + Consolidation = Retracement((again Bullish Continuation)).
So if retracement occurs, until which price we can expect, so if we see the technical chart
we don't have any strong bullish movement is observed,
every move depends on Resistance (Previous Resistances are pushing the price towards upside) ,acts as support and price moves upwards.
previous resistance @42000 pushed the price up, 43000 fall acts as support, and now 43600 fall is giving support to move again.
if price failed to acts as support @ 43600,we may expect a fall till 43000, and 42000.
Consider this as a retracement and be bullish from these levels. The last Hope.
This is another Scenario will explain Later Clearly::
From 46500 levels, if price started falling again we may see a strong sell of until 35000 and below is possible.
From bottom again price creates strong Demand Zones and moving again upwards.
so its clearly showing that we have only one last movement to bottom side that to 35000-34000 levels.
we have gaps below @ 35600 and @34400.
So clearly from 34000-35000 is the last move we can expect to the downside.
while breaking the previous resistance @41800 created on oct 2021, price fall back 4400 points.
After breaking the resistance price moved 2300 points from 41800 - 44200 levels.
now we are at the resistance 44200, if price fall from this levels,
we will expect the previous resistance @41800 level will push the price towards upside 2300 points from resistance, 44200+ 2300 = 46500 range.
If price failed to break the high 44200 level and breaks below 41800 then only think of sell side.
Elliott wave::
wave 1: 32300 to 41800
wave 2: 41800 to 37400
wave 3: 37400 to 44200
wave 4: 44200 to 38600
wave 5 : 38600 to 44200 + 2300 = 46500 levels.
If we consider the Elliott wave theory wave 5 is more than wave 3,
If this post is Helpful please Support me with like. Thanks
Note
Corrective wave ::Note
we are at supply zone, yesterday high is not broken and today's low if break can we expect a fall, till yesterdays low.Note
**If these ideas are Helpful !
Please Like, Follow and Comment
Also share your thoughts in the comments section.
Thanks for your Support **
--Educational Purpose Only--
--Not SEBI Registered--
" i am a IT-Trader "
Please Like, Follow and Comment
Also share your thoughts in the comments section.
Thanks for your Support **
--Educational Purpose Only--
--Not SEBI Registered--
" i am a IT-Trader "
Disclaimer
The information and publications are not meant to be, and do not constitute, financial, investment, trading, or other types of advice or recommendations supplied or endorsed by TradingView. Read more in the Terms of Use.