Volume Price Analysis
According to my insights from reading " A Complete Guide to Volume Price Analysis " by Anna Couling , this is what I understood with BATA INDIA Daily Chart :
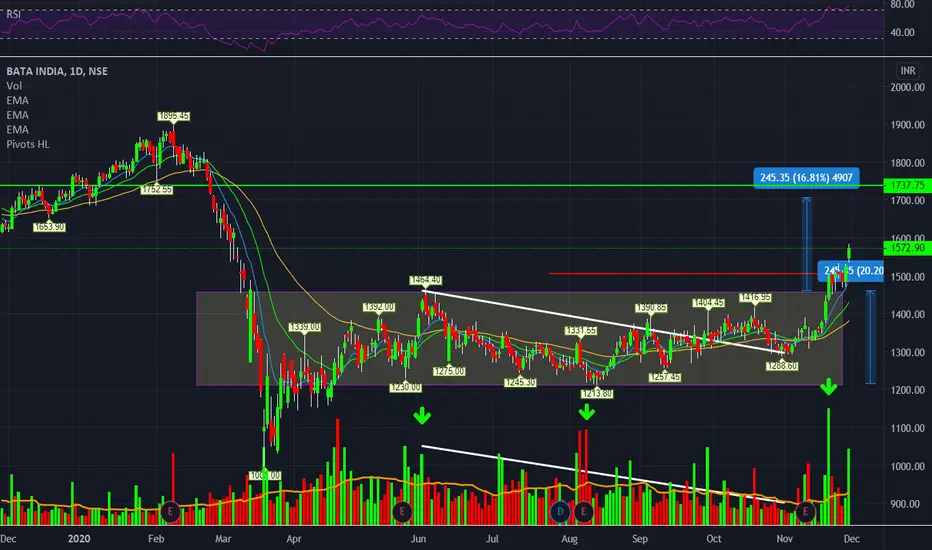
1. Accumulation Phase has occured from 19th March 2020
One can identify such phases with the help of spike in volumes and areas of support and resistance . Further more there has been an increase in volume prior to march , meaning increase in activity by insiders
2. Spike in Volumes on days of support and resistance
Upon identifying areas of support and resistance , there has been one common factor i.e spike in volume . The volume has had a sudden spike as pointed with the help of directional green arrows , one can further tell these are points of reversals as the 3rd Law of Wycoff : Law of Effort & Result is being negated with the movement in price on that particular day ( consider body of candle )
3. End of Accumulation Phase
One can understand the end of the accumulation phase with the movement in volume and movement in price . Volume gradually decreases as the price decreases , as you can see with the rough trend lines drawn to indicate the same
4. Beginning of Trend
The trend begins once the highest point of the accumulation phase has been broken , in this case 1464.40 , also backed by direct relation of volume and price from 17th Nov to 19th Nov , 19th Nov being the breakout candle
5. Target
Target would personally in my opinion be the height of the phase of accumulation. Distribution would occur around 1735 levels
P.S , This is my first analysis on VPA . It would be greatly appreciated to read your insights on this analysis
According to my insights from reading " A Complete Guide to Volume Price Analysis " by Anna Couling , this is what I understood with BATA INDIA Daily Chart :
1. Accumulation Phase has occured from 19th March 2020
One can identify such phases with the help of spike in volumes and areas of support and resistance . Further more there has been an increase in volume prior to march , meaning increase in activity by insiders
2. Spike in Volumes on days of support and resistance
Upon identifying areas of support and resistance , there has been one common factor i.e spike in volume . The volume has had a sudden spike as pointed with the help of directional green arrows , one can further tell these are points of reversals as the 3rd Law of Wycoff : Law of Effort & Result is being negated with the movement in price on that particular day ( consider body of candle )
3. End of Accumulation Phase
One can understand the end of the accumulation phase with the movement in volume and movement in price . Volume gradually decreases as the price decreases , as you can see with the rough trend lines drawn to indicate the same
4. Beginning of Trend
The trend begins once the highest point of the accumulation phase has been broken , in this case 1464.40 , also backed by direct relation of volume and price from 17th Nov to 19th Nov , 19th Nov being the breakout candle
5. Target
Target would personally in my opinion be the height of the phase of accumulation. Distribution would occur around 1735 levels
P.S , This is my first analysis on VPA . It would be greatly appreciated to read your insights on this analysis
Disclaimer
The information and publications are not meant to be, and do not constitute, financial, investment, trading, or other types of advice or recommendations supplied or endorsed by TradingView. Read more in the Terms of Use.
Disclaimer
The information and publications are not meant to be, and do not constitute, financial, investment, trading, or other types of advice or recommendations supplied or endorsed by TradingView. Read more in the Terms of Use.