Long
BAT vs USD
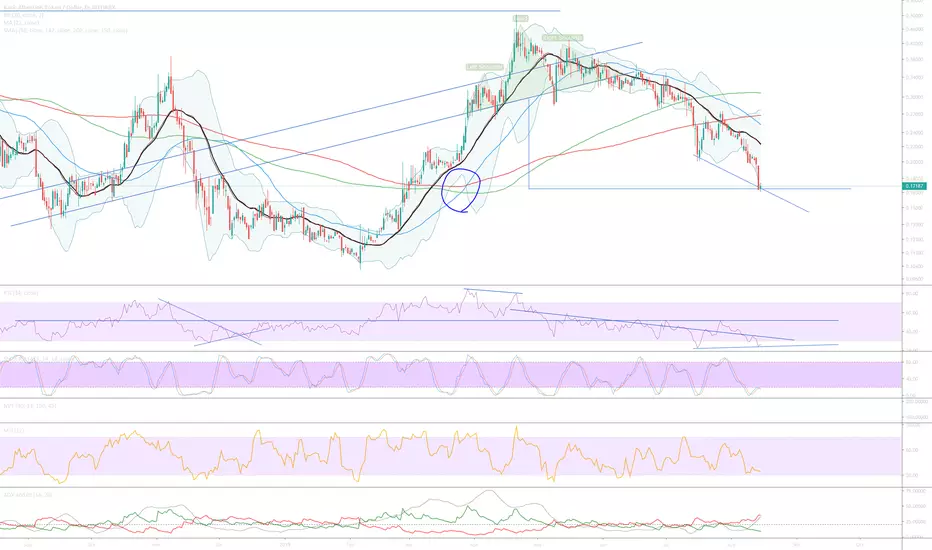
A number of interesting signals to take notice of. Firstly the trends, Price is now far below the moving averages, 21, 50, 150, 200 day, excellent. From the oscillators, higher lows now indicated on RSI showing a bullish divergence against price. Yes Stochastic RSI indicates more downside is possible, however I'm not interested in timing the market. Lastly the weekly chart below, higher lows on the Money flow index with a testing of past resistance indicating future support. Looks good.

BTC
bc1q2eckdzh0q8vsd7swcc8et6ze7s99khhxyl7zwy
Weblink: patreon.com/withoutworries
Allow 3-6 months on ideas. Not investment advice. DYOR
bc1q2eckdzh0q8vsd7swcc8et6ze7s99khhxyl7zwy
Weblink: patreon.com/withoutworries
Allow 3-6 months on ideas. Not investment advice. DYOR
Disclaimer
The information and publications are not meant to be, and do not constitute, financial, investment, trading, or other types of advice or recommendations supplied or endorsed by TradingView. Read more in the Terms of Use.