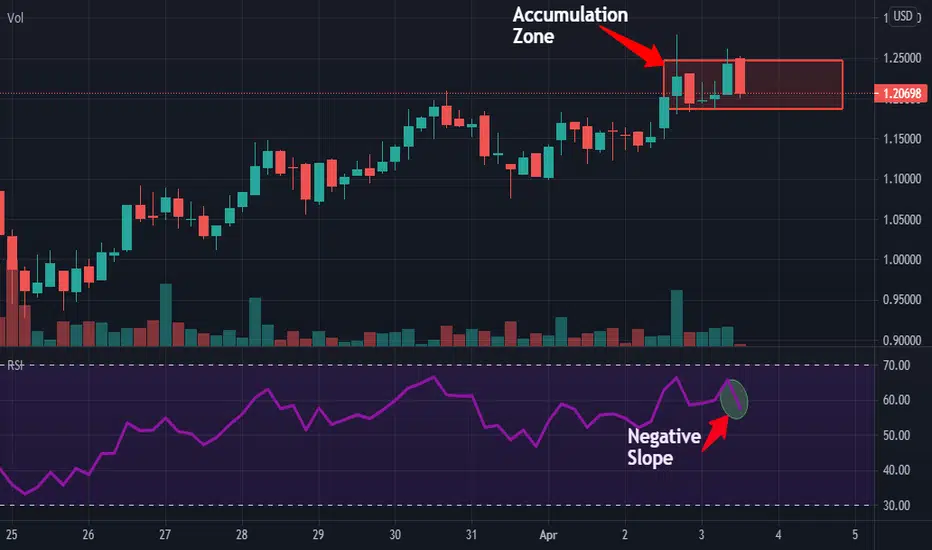
The weekly technical chart for BAT showcases a bullish momentum. On coming to the daily chart,BAT price is showing sign of a consolidated move. BAT price is trading above 50 and below 100 Moving Average. The 50MA price is at $0.817, making it temporary support for the coin. The coin's resistance on the upside will be at $1.3, and on the downside, it will see a bounce back from $1.BAT has formed an accumulation zone in the 4-hour time frame. If the price breaks 10% below the area, then a robust bearish momentum can be seen. BAT price can see a downtrend below $1 in the upcoming days.
Kindly comment your thoughts below
Related publications
Disclaimer
The information and publications are not meant to be, and do not constitute, financial, investment, trading, or other types of advice or recommendations supplied or endorsed by TradingView. Read more in the Terms of Use.
Related publications
Disclaimer
The information and publications are not meant to be, and do not constitute, financial, investment, trading, or other types of advice or recommendations supplied or endorsed by TradingView. Read more in the Terms of Use.