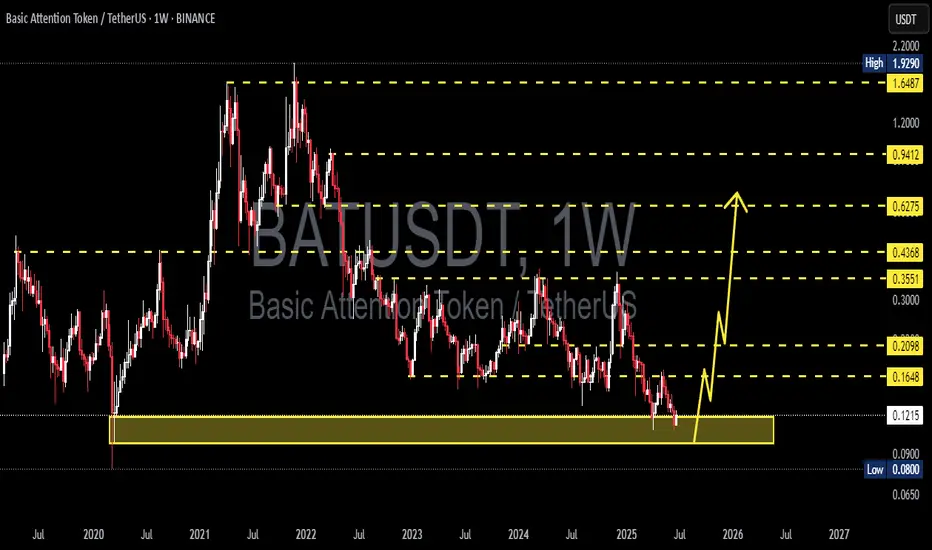
🔶 1. Strong Support Zone (Highlighted in Yellow):
A key demand zone lies between $0.080 – $0.1212.
This area has acted as strong support multiple times since 2020, showing signs of institutional accumulation or whale interest.
🔼 2. Bullish Reversal Scenario:
A recent bounce from this golden support zone suggests a potential bullish reversal.
The projected path (yellow arrows) illustrates a step-by-step rally toward multiple resistance levels.
Potential Upside Targets:
🔹 $0.1648 (Initial minor resistance)
🔹 $0.2098 (Previous consolidation zone)
🔹 $0.3551 (2023 distribution zone)
🔹 $0.4368 (Major pre-breakdown resistance)
🔹 $0.6275 (Medium-term bullish target)
🔹 $0.9412 – $1.6487 (Long-term resistance levels)
📉 3. Risk Management & Invalidations:
A weekly close below $0.1212 may trigger a move toward the $0.090 – $0.080 historical low zone.
A breakdown below that would invalidate the bullish outlook and call for a reassessment.
📆 4. Timeframe & Additional Signals:
This is a weekly timeframe chart, ideal for swing or long-term traders.
While volume confirmation is not yet strong, the early formation of a higher-low suggests a possible trend reversal.
✅ Conclusion:
BAT/USDT is currently trading in a high-probability reversal zone with strong historical support. If this zone holds, it could trigger a significant multi-level bullish rally. A good opportunity for patient traders with proper risk management.
✅ Get Free Signals! Join Our Telegram Channel Here: t.me/TheCryptoNuclear
✅ Twitter: twitter.com/crypto_nuclear
✅ Join Bybit : partner.bybit.com/b/nuclearvip
✅ Benefits : Lifetime Trading Fee Discount -50%
✅ Twitter: twitter.com/crypto_nuclear
✅ Join Bybit : partner.bybit.com/b/nuclearvip
✅ Benefits : Lifetime Trading Fee Discount -50%
Disclaimer
The information and publications are not meant to be, and do not constitute, financial, investment, trading, or other types of advice or recommendations supplied or endorsed by TradingView. Read more in the Terms of Use.