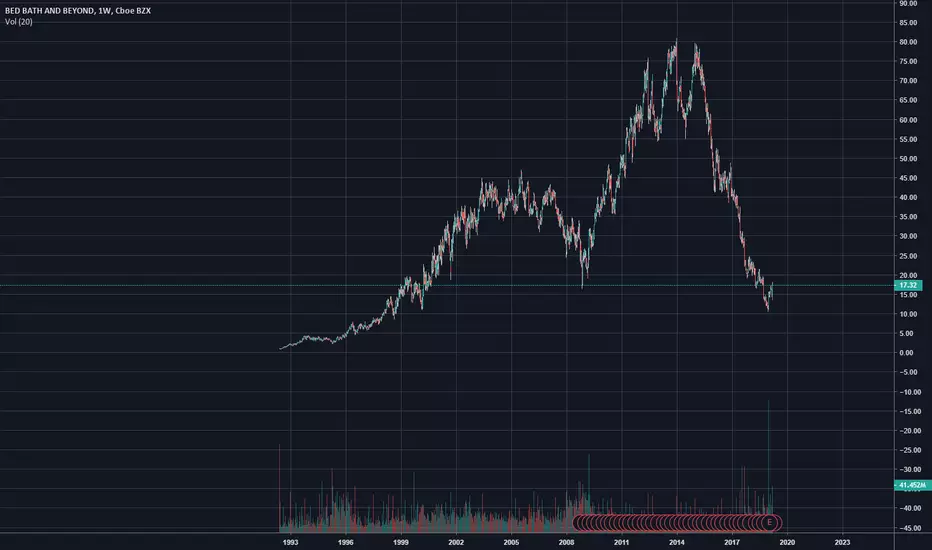
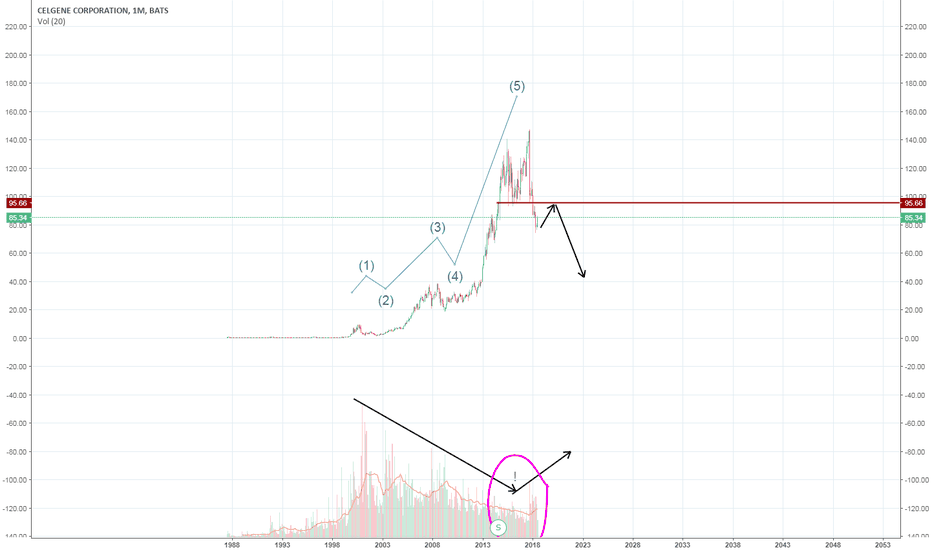
More warning signs here. How can someone deny the extreme high probability of a recession with so many consumer cyclicals looking like this. We were due for a pullback in 2016 that we never got because tech kept soaring to the moon. But reckoning is very close. Many stocks will look like this soon.
This stock may or may not be a buy, im not about to start bottom feeding because of a 25% gap in one day. But this chart is ominous. Just like celgene, and so many others.
This stock may or may not be a buy, im not about to start bottom feeding because of a 25% gap in one day. But this chart is ominous. Just like celgene, and so many others.
Note
the only difference is it was delayed by 3 years due to the FAANG bubble (tech bubble 2.0)Related publications
Disclaimer
The information and publications are not meant to be, and do not constitute, financial, investment, trading, or other types of advice or recommendations supplied or endorsed by TradingView. Read more in the Terms of Use.
Related publications
Disclaimer
The information and publications are not meant to be, and do not constitute, financial, investment, trading, or other types of advice or recommendations supplied or endorsed by TradingView. Read more in the Terms of Use.

