Long
BBIG Bulls/Bears fighting at the 200MA
$NASDAQ:BBIG
The chart speaks!
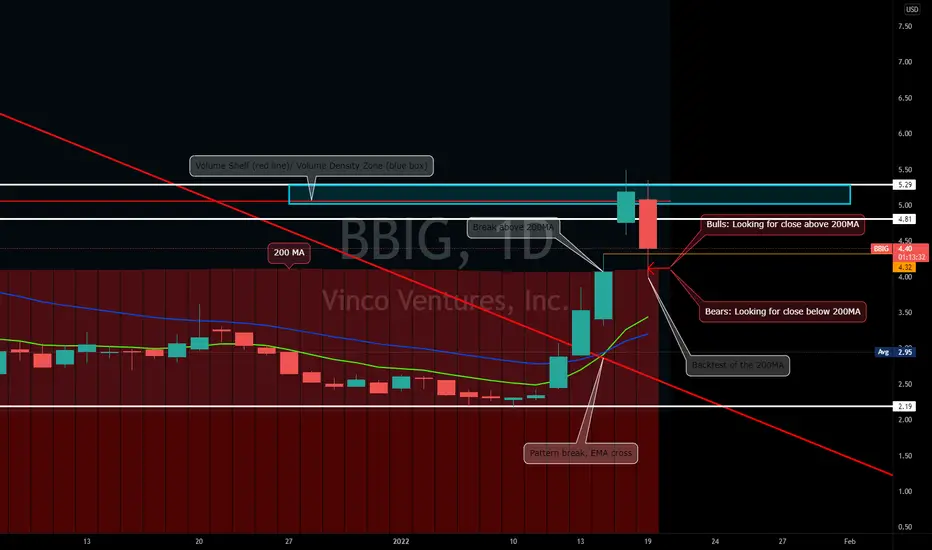
The bulls and bears are toughing it out at the 200MA - can you see it?
Bullish setup: a daily candle that closes above the 200MA and retests the $5-5.30 volume shelf with the proceeding candle
Bearish setup: a daily candle closes below the 200 MA and proceeds to close a candle below the Jan 14 support level of $3.80
The chart speaks!
The bulls and bears are toughing it out at the 200MA - can you see it?
Bullish setup: a daily candle that closes above the 200MA and retests the $5-5.30 volume shelf with the proceeding candle
Bearish setup: a daily candle closes below the 200 MA and proceeds to close a candle below the Jan 14 support level of $3.80
Related publications
Disclaimer
The information and publications are not meant to be, and do not constitute, financial, investment, trading, or other types of advice or recommendations supplied or endorsed by TradingView. Read more in the Terms of Use.
Related publications
Disclaimer
The information and publications are not meant to be, and do not constitute, financial, investment, trading, or other types of advice or recommendations supplied or endorsed by TradingView. Read more in the Terms of Use.