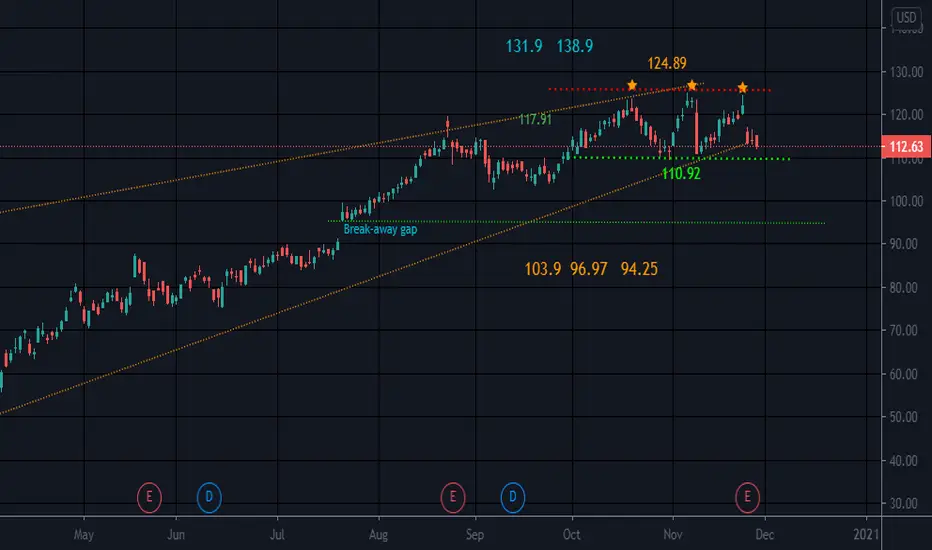
BBY looks to be trading in a rectangle. R (resistance) overhead and S (support) below at bottom trendline of the pattern..
There is a break-away gap below price that may provide a strong level of S if, and only if, this were to break down to that level..
A rectangle is a continuation pattern but can also be a reversal pattern..
Rectangles are like a horizontal channel. Price bumps it's head on the R above and saved by the S below. They do not go on forever though and price will break up or down eventually..
Targets are listed for a break down or a break up. Mid Rectangle can be a stop whichever way price decides to go...
This can also be called a rectangle top because price entered from the bottom (creating a top).
BBY has been traveling in a possible rising and narrowing channel for quite a while
Guessing which way this will break can be a death wish until one of the trendlines are broken...Best to have at least 5 touches, 3 on one trendline and 2 on the other...If the rectangle is tal enough, folks sometimes swing trade inside of this pattern.
Note
Before considering a swing trade of this stock, I would be watch it be extremely careful as there is a possible rising wedge (bearish) and the monthly and weekly candles are bearish today. Things change though. Be safeNote
and a head and shoulders topDisclaimer
The information and publications are not meant to be, and do not constitute, financial, investment, trading, or other types of advice or recommendations supplied or endorsed by TradingView. Read more in the Terms of Use.
Disclaimer
The information and publications are not meant to be, and do not constitute, financial, investment, trading, or other types of advice or recommendations supplied or endorsed by TradingView. Read more in the Terms of Use.
