Long
Bcashtastic
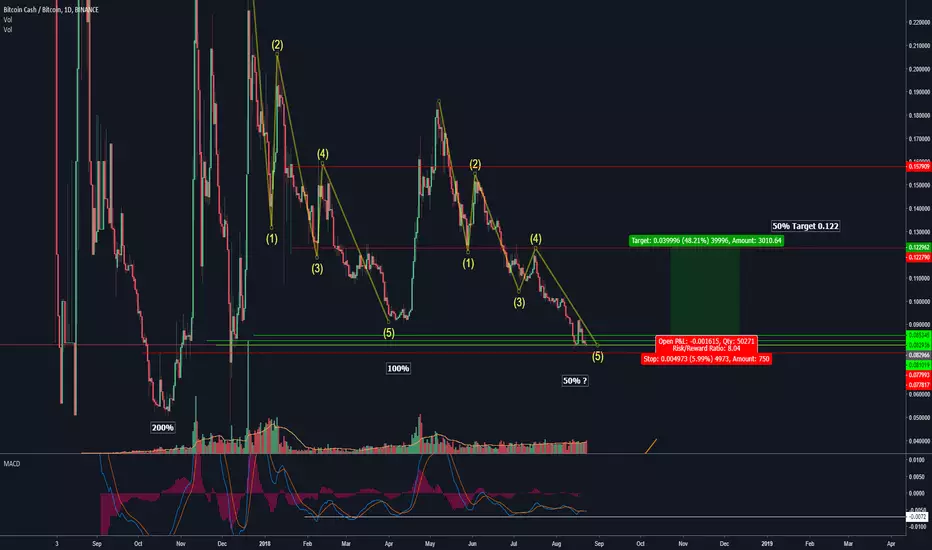
Evident 5 waves down if you compare this downside move to the previous one; hard to pick a good entry but i have based it on the wave and fractal.
noticed an interesting percentage correlation highlighted in the text boxes, also the macd indicator is respecting a lower boundary.
Aiming for 50% on the upside from here marked on the chart with a green flag, it may fall through which is why risk management is no.1 in any area of trading
Good luck and may the Ver be with you. Basil
Trade active
Bcash Wicked right down to my stop and took a small percentage of the trade out; but bounced back and found resistance. if it gets stopped out entirely we will take it on the chin and look for another entry. This is a perfect example of why not to place a stop limit buy or sell order on 100% of your position anywhere on a chartBasil
Note
Waiting for the magic to happen - Red line stop limit unchanged from original chart, This is a fun trade to be in, may the ver be with you
Trade active
8H Timeframe is showing signs of buyers coming back in, Cloned previous fractal and adjusted slightly here;Trade active
Bitcoin cash wicked up to within 3.5% of my predicted target but the 4h turned to red and quickly got rejected; greay example of why to ladder sells and buys up to your target prices. see the white arrow in the following chart: Trade closed: stop reached
Stopped out of the remaining aggregate awaiting some chart formation to appear which will guide us towards the direction of movement.Note
Sitting on the sidelines adding bits, this rsi divergence on the daily chart looks ripe for a pump, determining the price floor however is another story; watch this space.Note
looking at the same chart formation in 2d format there is a impulse on the relative strength however using any larger time frames it is not yet showing. Bitcoin is at a critical level and ultimately will be the decider of the direction of BCH with traders protecting satoshis.Note
^^ Double post ^^2D CHART:
Note
4h Candles; Handbrake is being applied but green box needs to be tested and proved as Support to see upside momentum;Note
to put things into perspective, here is zero on log scale...set stops wisely :D3BMEXXcTaoHJcQ9RejFVCvhiDJxqcHbAie
Note
Note
moving upwards and through buy zoneTrade active
Note
1.618% ?Trade active
Put together a few reasons as to why im longing the BCC/BTC pair with some potential target levels. fractals looking gdNote
Confident in seeing upside to 0.125 which would bring wave (5) into an ABC correction time will tell in the coming weeks the strength of the uptrend, we could find resistance under (3) or push right up to (4) Looking at factors such as chart formation; previous price action and divergences over larger timeframes will bring clarity to the trade and enable positioning to be smooth and precise.Note
.0860 needs to break and hold for further upside. heres a log chart zoomed out with (0) added, a long way down in we fail to move up here.Trade closed manually
Bicoin cash looking bearish and unable to hold a trend here. will re visit another time at more appealing USD levelsTrade closed: stop reached
Closing into a pump if weakness occurs is an alternative way to shave a few percent off your potential losses if you see a reversal on the larger time frame charts.Note
Quick chart with few signals to back up the bearish scenario which has unfolded since the fractal failed to break upwards in price through the first fib level. Note
Fibs flipped. 0.88 rejection too Note
still dedDisclaimer
The information and publications are not meant to be, and do not constitute, financial, investment, trading, or other types of advice or recommendations supplied or endorsed by TradingView. Read more in the Terms of Use.
Disclaimer
The information and publications are not meant to be, and do not constitute, financial, investment, trading, or other types of advice or recommendations supplied or endorsed by TradingView. Read more in the Terms of Use.