Short
BCHABC Short
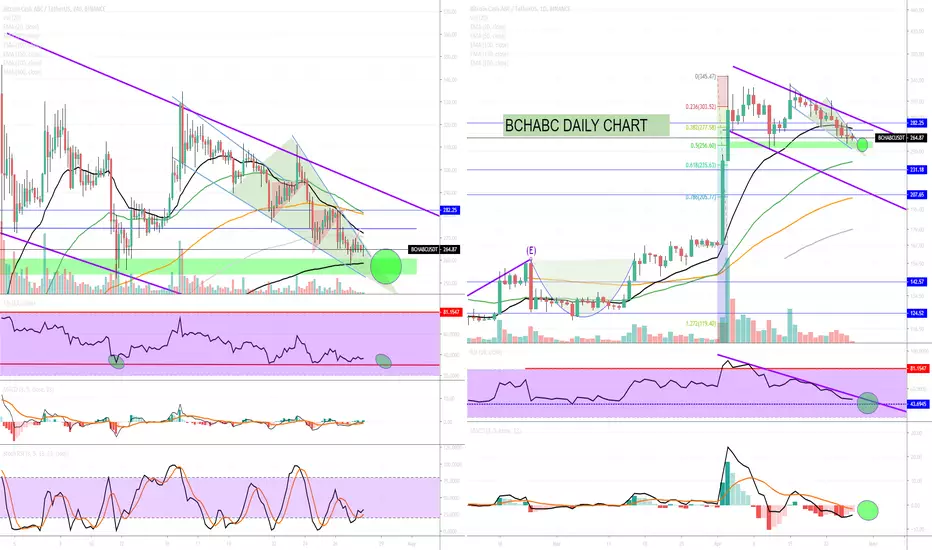
BCHABC Trend Hypothesis
> Green sphere represents buy zone, trend reversal
> If the trend continues down this path, BCHABC seems to indicate over sold conditions (RSI level matching previous drop level)
> Approaching strong support lines and backed by the 4hrly 200 EMA and Fib.level. 0.5
> Pattern flat towards the bottom
> Seems to line up with BTC imminent potential breakup
Trade active
I should have added the following:Breakup is to the top of the channel ~$280s (Purple line). I don't have much faith that it will go higher based on recent ALT performances. Right now I see it as accumulation period for the 280 target.
Trade active
Update:RSI has hit the target on the daily and 4 hrly.
MACD is yet to complete on the daily.
We have a reversal candle on the daily and 4hrly.
Momentum is below zero on the 4 hrly.
We might have to just wait a little longer for the Macd to complete.
Trade active
Update:Macd has now increased in the downward strength which is reflected by the 8% drop and RSI reflecting the same downward energy.
I would not feel comfortable until BTC stops at a strong support line.
I read where some said the following:
"Altcoins are also being sold to bitcoins cause there might not be enough depth for the whale to exit in Altcoin/Tether. They have to sell altcoins to bitcoins , which serves as an equivalent while temporary support to bitcoin , and dump those bitcoins to exit".
reference:
Note
BCHABC Chart for 4 hrlyDiscord: discord.com/invite/vb4hbP88vb (TradeToProspa)
Telegram: t.me/TprospaTradersbot
This community has signals now but with no risk management comms.
Telegram: t.me/TprospaTradersbot
This community has signals now but with no risk management comms.
Disclaimer
The information and publications are not meant to be, and do not constitute, financial, investment, trading, or other types of advice or recommendations supplied or endorsed by TradingView. Read more in the Terms of Use.
Discord: discord.com/invite/vb4hbP88vb (TradeToProspa)
Telegram: t.me/TprospaTradersbot
This community has signals now but with no risk management comms.
Telegram: t.me/TprospaTradersbot
This community has signals now but with no risk management comms.
Disclaimer
The information and publications are not meant to be, and do not constitute, financial, investment, trading, or other types of advice or recommendations supplied or endorsed by TradingView. Read more in the Terms of Use.