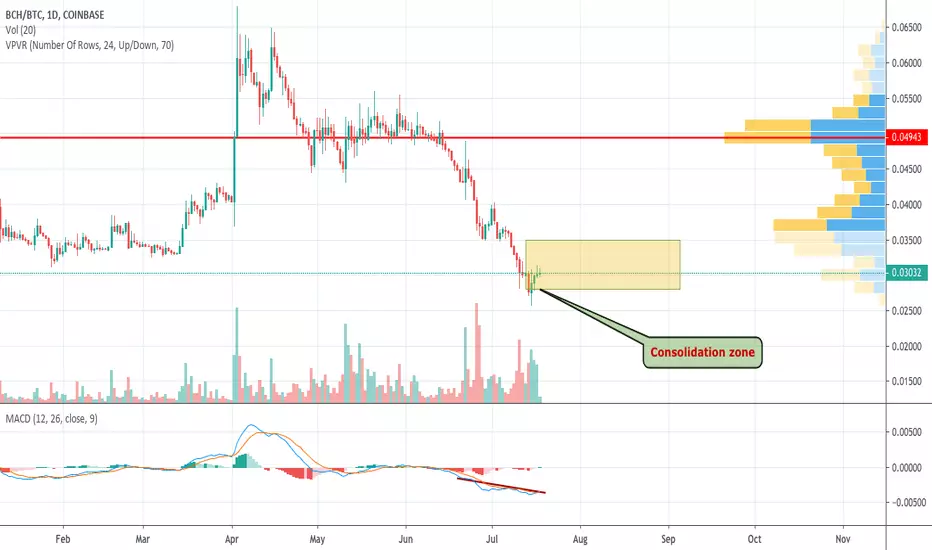
Our earlier Bitcoin Cash prediction came true, as the coin confirmed its bullish trend to the nearest resistance at 0.03050 BTC.
Analyzing BCH against Bitcoin on the 1D chart, the asset is still located under bearish tendencies, which is confirmed by the declining MACD indicator. The nearest scenario is a consolidation in the yellow corridor between 0.028 BTC and 0.035 BTC. The price is unlikely to go higher due to the absence of buyers and low trading volume.
Analyzing BCH against Bitcoin on the 1D chart, the asset is still located under bearish tendencies, which is confirmed by the declining MACD indicator. The nearest scenario is a consolidation in the yellow corridor between 0.028 BTC and 0.035 BTC. The price is unlikely to go higher due to the absence of buyers and low trading volume.
Disclaimer
The information and publications are not meant to be, and do not constitute, financial, investment, trading, or other types of advice or recommendations supplied or endorsed by TradingView. Read more in the Terms of Use.
Disclaimer
The information and publications are not meant to be, and do not constitute, financial, investment, trading, or other types of advice or recommendations supplied or endorsed by TradingView. Read more in the Terms of Use.