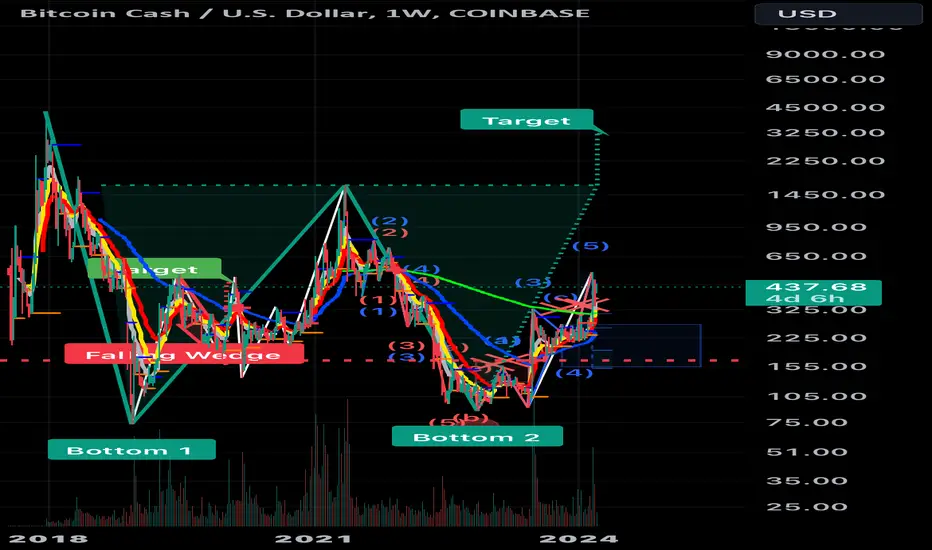
The BCH/USD weekly chart displays a pattern resembling a giant double bottom. If this pattern plays out, technical analysis suggests a possible price target exceeding $3200. Due to Bitcoin's historical dominance in the market, some consider Bitcoin Cash a "clone" and speculate that its price movements might echo Bitcoin's to a certain extent. This concept is similar to the idea explored in the movie Star Wars: Episode II – Attack of the Clones.
Trade active
Note
It’s all funny until it happensNote
Note
Smart money is buyingTrade active
Note
Moving faster than most people expected I’m sure.Note
Immediate resistance is around $736Trade active
StrongNote
Note
Might be time for a pullback on the 4hr. Bearish divergence is building.Note
USDT: 0xd3787d843Cf915E5475119459B34b6429827c297
Disclaimer
The information and publications are not meant to be, and do not constitute, financial, investment, trading, or other types of advice or recommendations supplied or endorsed by TradingView. Read more in the Terms of Use.
USDT: 0xd3787d843Cf915E5475119459B34b6429827c297
Disclaimer
The information and publications are not meant to be, and do not constitute, financial, investment, trading, or other types of advice or recommendations supplied or endorsed by TradingView. Read more in the Terms of Use.