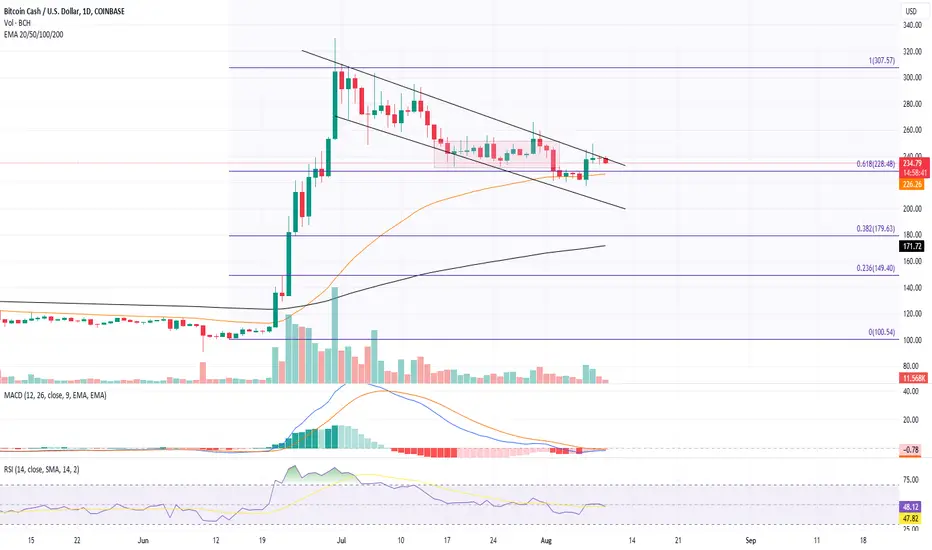
- Falling Channel Pattern: Extensive selling pressure above $300 led to a falling trend, taking support at the 50-day EMA and 23.60% Fibonacci level, dropping to $220.
- Bullish Flag Pattern: The correction phase is seen as part of a bullish flag pattern, following a 200% jump in late June, signaling a potential uptrend beyond $300.
- 6.63% Jump on 7th August: This jump, along with bullish confluence at the 23.60% Fibonacci level and 50-day EMA, projected a potential breakout, but higher price rejection prolonged the bear trend.
- 1.70% Fall and Morning Star Pattern: A fall followed by a couple of Doji formations leads to a morning star pattern, teasing a potential drop to $210.
- Positive Technical Indicators: Despite the bearish signs, the MACD indicator is preparing for a bullish crossover, and the RSI line shows an uptick, predicting a positive outlook for August.
- Potential New Bull Cycle: A daily candle closing above the falling channel could signal a new bull cycle, possibly challenging the previous swing high of $307.
- Risk of Downfall to $200: A continuation of the current downfall could test the bullish dominance at the psychological mark of $200, posing a risk to the upward momentum.
Disclaimer
The information and publications are not meant to be, and do not constitute, financial, investment, trading, or other types of advice or recommendations supplied or endorsed by TradingView. Read more in the Terms of Use.
Disclaimer
The information and publications are not meant to be, and do not constitute, financial, investment, trading, or other types of advice or recommendations supplied or endorsed by TradingView. Read more in the Terms of Use.