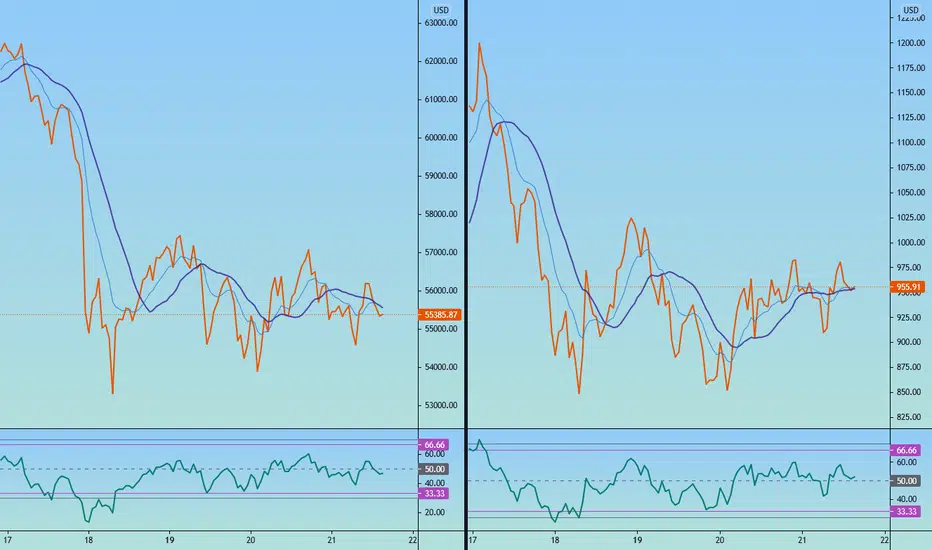
Here is a simple chart showing how both BTC and BCH are consolidating after a large move down. While experience tells us that one move down is usually followed by another, we should not expect it. BTC is currently more bearish on the daily and 4-hr charts. While BCH is in an uptrend its price more than doubled in April. Price could pullback more, but the hourly chart is leaning bullish; there will be mixed signals until consolidation breaks.
Study RSI - on both charts, RSI broke 33.33, which usually means that it will stall between 60-66 and make another move down. As you look at other charts (stock or crypto) you will note that 34-40 is a bull support zone in uptrends. RSI rarely breaks 33.33, so it is a strong bearish sign when it does.
BTC price is already moving lower with RSI below 50 and 20sma rounding down; however it is still consolidating. BCH has a flat 20sma is also in a narrowing range, and RSI has not yet tested the 50. These levels, 33.33 and 66.66 were proposed by J. Hayden and only use them on 14-day RSI (not 7-day). They are very useful on a 30m chart for day and swing trading; I find on smaller timeframes, especially with volatile stocks/crypto, the levels are not useful.
Note
If the uptrend is ready to resume, there will be a higher high closing price on the hourly charts.Disclaimer
The information and publications are not meant to be, and do not constitute, financial, investment, trading, or other types of advice or recommendations supplied or endorsed by TradingView. Read more in the Terms of Use.
Disclaimer
The information and publications are not meant to be, and do not constitute, financial, investment, trading, or other types of advice or recommendations supplied or endorsed by TradingView. Read more in the Terms of Use.