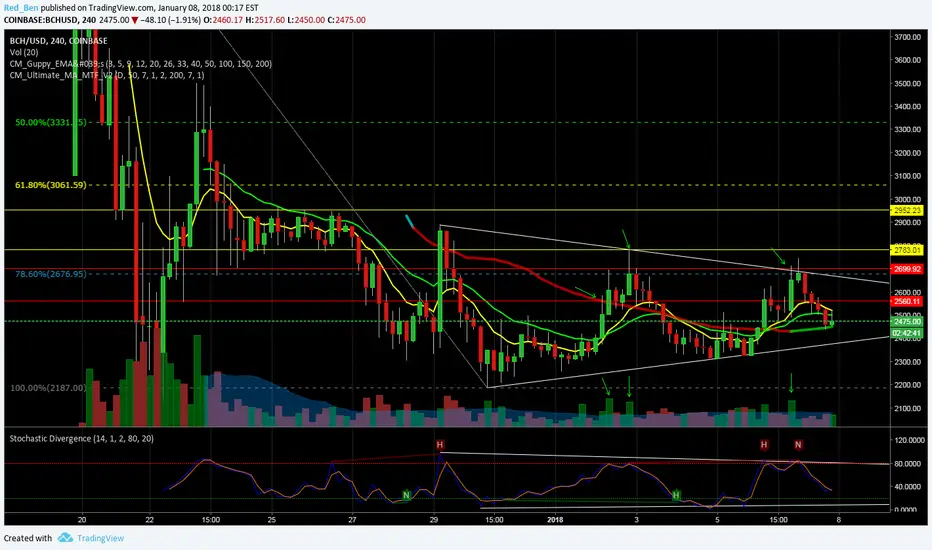
As for a counter-argument, the green 4hr 20 EMA is proving hard to hold above and is being respected on backtests during distribution and breakdown phases. Sellers are being found in the 2700's consistently. Hard to say how many tests it will take to overcome that sell wall and whether they will give way before support dries up.
However, red volume bars are all avg or below average today, despite a failed attempt to break over resistance. This pushes me to believe we are looking for a move higher, and it's likely worth accumulating more coins here. Could it be a very large bear flag? Of course! But if the Stochasics bounce off the oversold condition, price meets the lower trendline again, or we see price hold the 20 EMA on a dip, why not take an entry, if nothing else for a relatively easy scalp to 2700? Expect some resistance in the yellow zone on the chart. 3k is likely the true pivot point that will change this chart from bearish to bullish. A break and hold of 3k and this one is going higher.
Note
BCH gave 1 more buying opporutnity, but now looks ready to go. Time to load up!
Disclaimer
The information and publications are not meant to be, and do not constitute, financial, investment, trading, or other types of advice or recommendations supplied or endorsed by TradingView. Read more in the Terms of Use.
Disclaimer
The information and publications are not meant to be, and do not constitute, financial, investment, trading, or other types of advice or recommendations supplied or endorsed by TradingView. Read more in the Terms of Use.