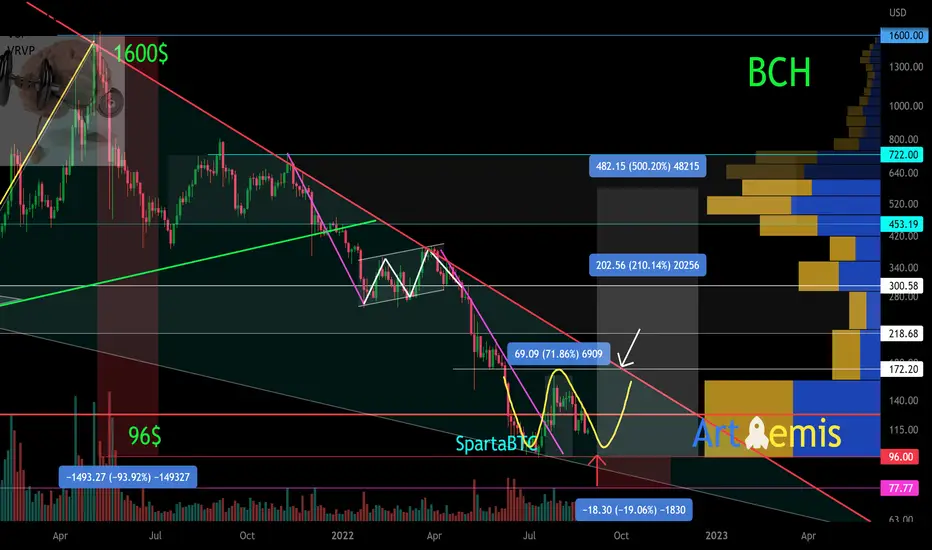
The graph is logarithmic.Time frame is 3 days. Secondary trend. The wedge is in the final phase of its formation. The price is in its band near the support area of 96. Local double bottom 72% may be formed inside the wedge. Its confirmation and embodiment will bring the price closer to the wedge resistance breakthrough (red line). The price is near the area of historical lows of $77. The price is now $115 Percentage from the key local zones shown on the chart. Remember, the price is now within the wedge band.
Coin in coinmarketcap: Bitcoin Cash
Line chart.

Local trend. Double Bottom Zone.

Main trend was shown earlier in this trading idea.
BCH/USD Main trend. Breakdown of the channel. The important zone
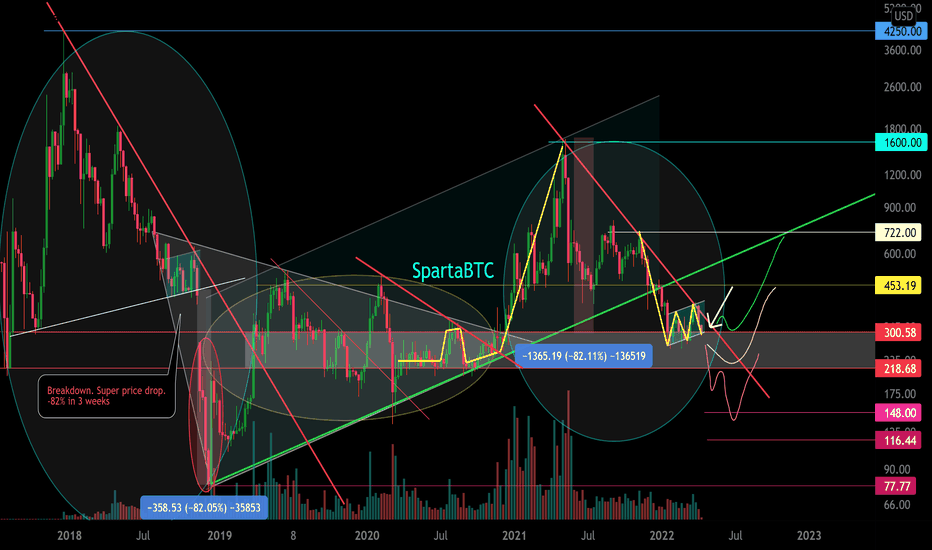
Main Trend. Linear chart.

Coin in coinmarketcap: Bitcoin Cash
Line chart.
Local trend. Double Bottom Zone.
Main trend was shown earlier in this trading idea.
BCH/USD Main trend. Breakdown of the channel. The important zone
Main Trend. Linear chart.
Note
Note
Note
Note
High probability of break up and continuation of the uptrend. It is quite possible after collecting a stop loss. If down, then to the support of the accumulation channel, unless there is something extraordinary in all markets (“black tale”).
Triangle formation in the zone of the accumulation channel of 300 days (10 months). The price is sideways, in the so-called "saw". Soon the dénouement.
High probability of break up and continuation of the uptrend. It is quite possible after collecting a stop loss. If down, then to the support of the accumulation channel, unless there is something extraordinary in all markets (“black tale”).
Note
Note
Note
Note
Upward breakout - this triangle acts as an ascending pennant (high probability).
Downward breakout - formation of a descending channel, which conditionally can act similarly with the resumption of the upward movement by the ascending channel.
An important point is the breakout of resistance of the dynamic downtrend (marked in red).
Note
Note
Everything is the same as before, in longing rationally stops on purchases. If you work in short, the stop is obligatory. There can be false breakdowns from this price squeeze zone, on both sides there is a huge amount of #stopLoss (fuel).
Trade closed: target reached
From the average price of the main accumulation of 372 days of 124.96 level - more than +340%. Now the price in the moment is $396.66
Globally very high potential, naturally with understandable, normal pullbacks in a rising trend.
✅ Telegram. Finance + Trading: t.me/SpartaBTC_1318
✅ Telegram. Сrypto trading only: t.me/SpartaBTC_tradingview
✅ Instagram: instagram.com/spartabtc_1318
✅ YouTube (Rus): goo.su/vpRzRa2
✅ Telegram. Сrypto trading only: t.me/SpartaBTC_tradingview
✅ Instagram: instagram.com/spartabtc_1318
✅ YouTube (Rus): goo.su/vpRzRa2
Related publications
Disclaimer
The information and publications are not meant to be, and do not constitute, financial, investment, trading, or other types of advice or recommendations supplied or endorsed by TradingView. Read more in the Terms of Use.