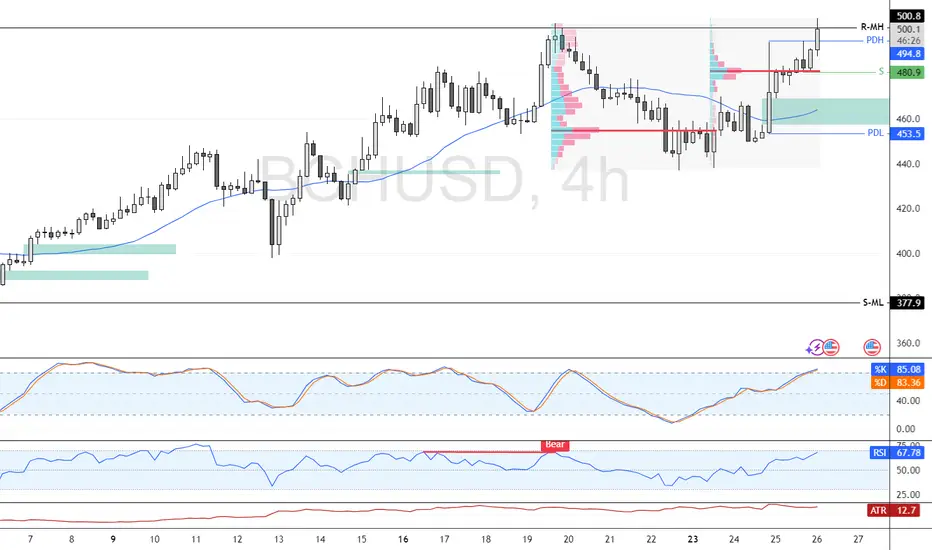
Bitcoin Cash rose to $500.0, a resistance zone backed by the June 19 high. Stochastic reads 85.0, indicating short-term overpricing.
The 4-hour chart shows a possible double top pattern, suggesting consolidation. If BCH stays below $500.8, it could target $494.8 and, if selling continues, drop to $480.9.
The 4-hour chart shows a possible double top pattern, suggesting consolidation. If BCH stays below $500.8, it could target $494.8 and, if selling continues, drop to $480.9.
Knowledge Should Be Free – And So Is Your Path to Trading Success.
Disclaimer
The information and publications are not meant to be, and do not constitute, financial, investment, trading, or other types of advice or recommendations supplied or endorsed by TradingView. Read more in the Terms of Use.
Knowledge Should Be Free – And So Is Your Path to Trading Success.
Disclaimer
The information and publications are not meant to be, and do not constitute, financial, investment, trading, or other types of advice or recommendations supplied or endorsed by TradingView. Read more in the Terms of Use.